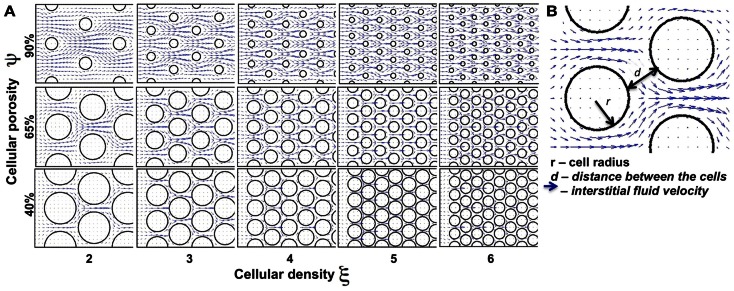
Figure 3.
Differences in the tissue’s cellular structure. (A) Collection of tissue samples with regularly distributed cells with various values of cellular porosity ψ (defined as a percentage of void spaces in the tissue; here ψ = 40, 65, 90%) and cellular density ξ (determined by the number of cells in each column; here ξ = 2, 3, …, 6). Tumor cells are represented by circles and the interstitial fluid velocity field initiated at the left edge of the domain is shown as blue arrows pointing in the direction of fluid flow. (B) The interstitial space is determined by the size (r) of the cells and distance (d) between the neighboring cells.

