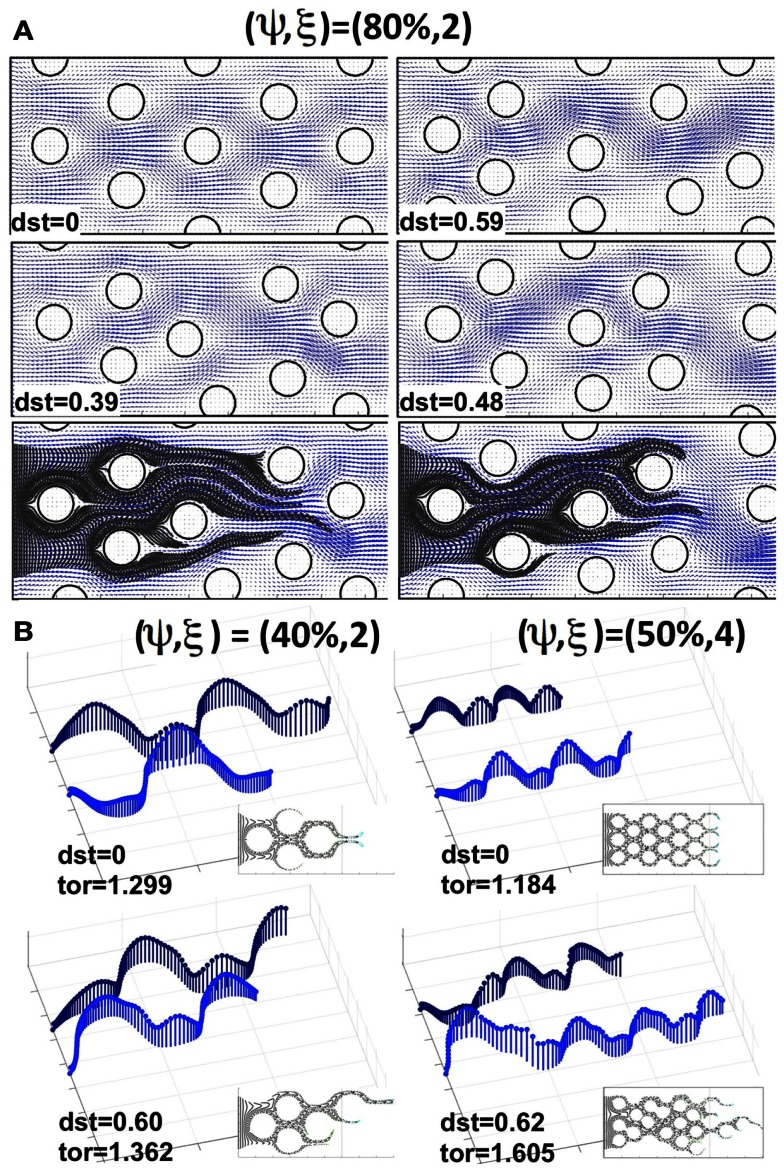
Figure 5.
Comparison of drug particle traces and tortuosity in regular and irregularly perturbed tissue geometries. (A) A regularly packed tissue (upper left corner) and three cases of irregular geometries (upper right corner and middle row), all with a cellular porosity of ψ = 80% and cellular density of ξ = 2 cells, together with the resulting interstitial fluid velocity fields and indicated distortion (dst). Bottom row: traces of drug particles along the “corridors” with a higher interstitial fluid flow for the two irregular geometries shown in the middle row. (B) The effective paths of two representative drug particles (the same in each tissue) for a pair of regularly and irregularly packed tissues: (ψ, ξ) = (40%, 2) and (ψ, ξ) = (50%, 4). The length of each vector (blue) indicates the speed of a particle at the given position. Insets show traces of several other drug particles for the given tissue topology. The maximal tortuosity values (tor) for each tissue are provided.

