Figure 7.
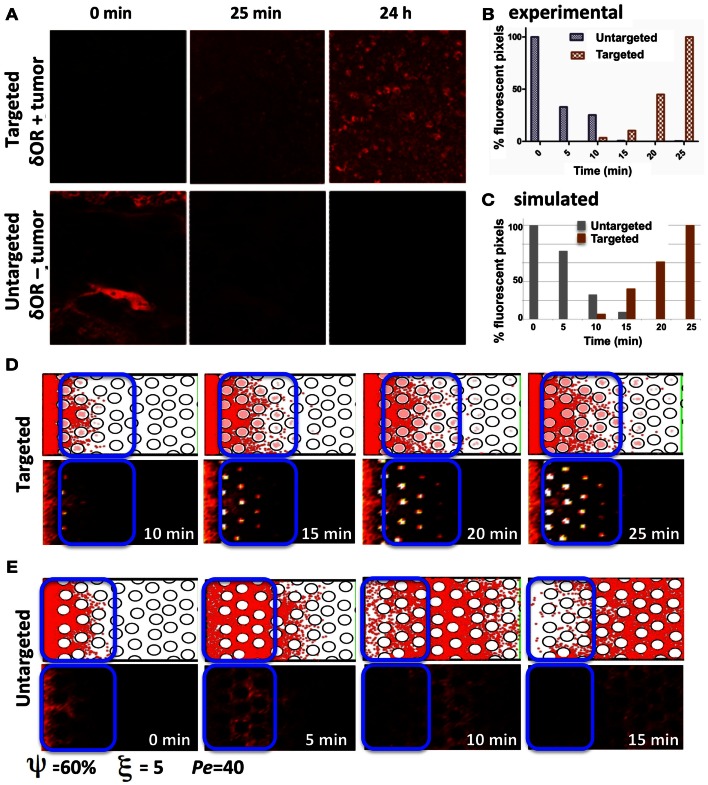
Penetration of targeted and untargeted imaging agents: comparison of simulated and experimental data. (A) Confocal fluorescence microscopy images of target-expressing DWC tumors (top) and non-expressing tumors (bottom) at time-points immediately following the injection of the targeted fluorescent probe. (B) For both the targeted and untargeted tumors, the bar graph represents the percentage of pixels with fluorescence intensities above a threshold value higher than the low background signal over a 25 min time-course, with 100% being equal to largest number of pixels above the background in the time-course. (C) The quantification of the simulated results from the section of the tissue indicated as a blue window in (D,E). The simulated data has been normalized as in (B) for comparison. (D) The time sequence from a simulation with cellular uptake via receptor binding (targeted); the top images show individual particles, and the bottom images show the corresponding fluorescent rendering. (E) Time sequence from a simulation without cellular uptake (untargeted). Both simulations were run for the same tissue structure with a cellular density of ξ = 5, cellular porosity of ψ = 60%, and Péclet number of Pe = 40.

