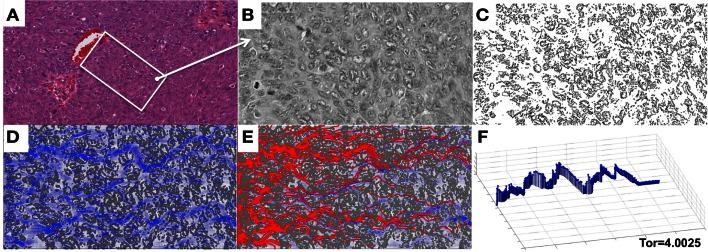
Figure 8.
Penetration of drug particles through a digitized ovarian tumor tissue. (A) An original H&E-stained histological image of ovarian tumor tissue with a centrally located vein. (B) A small patch of tissue selected from (A) and used for digitization. (C) A digitized version of the histological image from (B) used for computational simulations. (D) The simulated interstitial fluid flow (blue). (E) The resulting traces of the simulated particles representing the drug or biomarker molecules. (F) The particle trace with maximal tortuosity of 4.0025.

