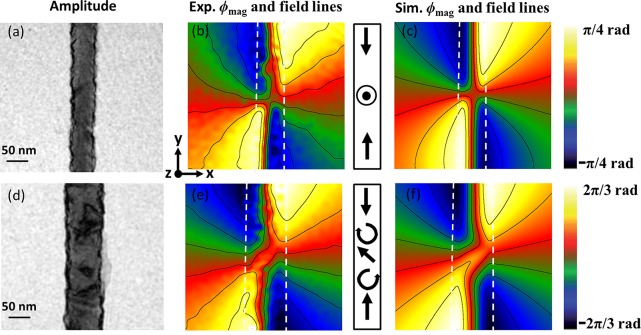
Figure 3.
Transverse DW and hybrid magnetic state in 55 and 85 nm nanocylinders. (a and d) Amplitude image of 55 and 85 nm nanocylinders, respectively. (b and e) Experimental magnetic phase shift and corresponding induction field lines. (c and f) Magnetic phase shift and corresponding induction field lines calculated from micromagnetic simulation. The difference of isophase contour is the same for the experiment and simulation, showing the quantitative agreement, and is set to 0.6 and 0.3 rad for 55 and 85 nm, respectively. The color bars on the right give the amplitude of the phase shift in radian. The dashed lines are a guide for the eye to position the wires. The arrows on the scheme represent a simplified view of the magnetization within the wire.

