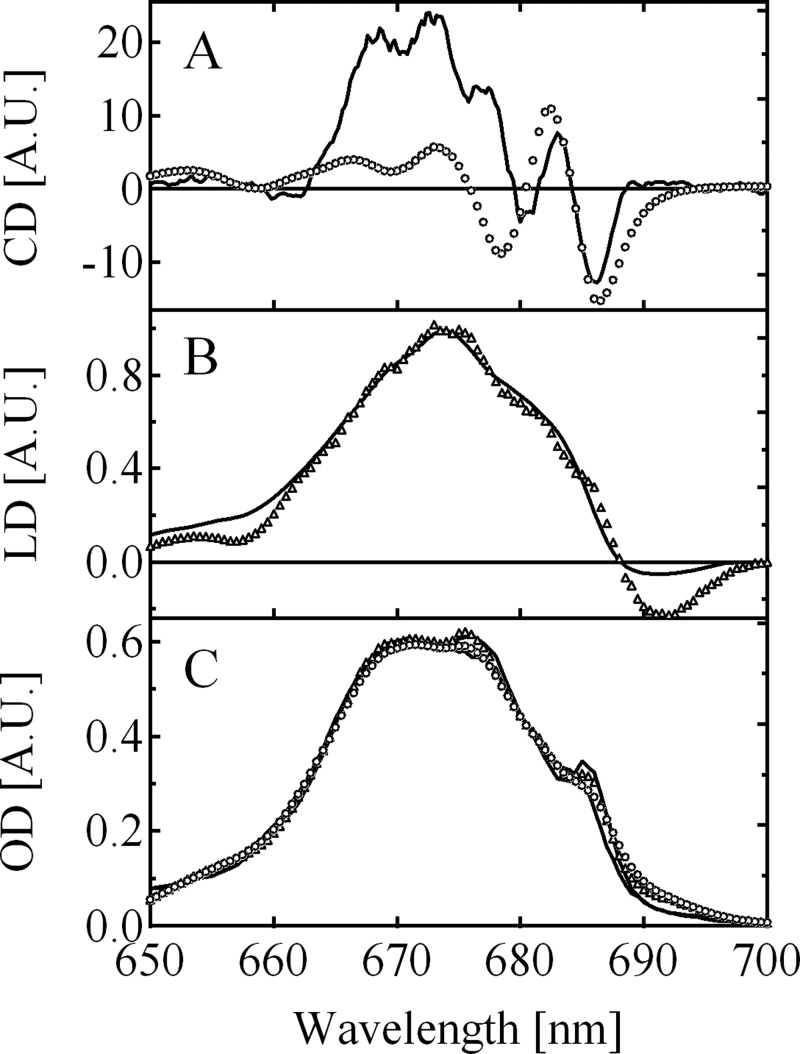
Figure 4.
Comparison of the experimental (A) circular dichroism (present study),(B) linear dichroism,43 and (C) absorption (present study) spectra of the cyanobacterial PS II-CC dimer from Thermosynechococcus sp. with the calculated spectra using the site energies in Tables 1 and 2 (RC and CP47, respectively) and modified ones in CP43 listed in Table 4. The solid lines show the experimental data at 5 and 77 K. The triangles and circles show the calculated spectra at 5 and 77 K, respectively.

