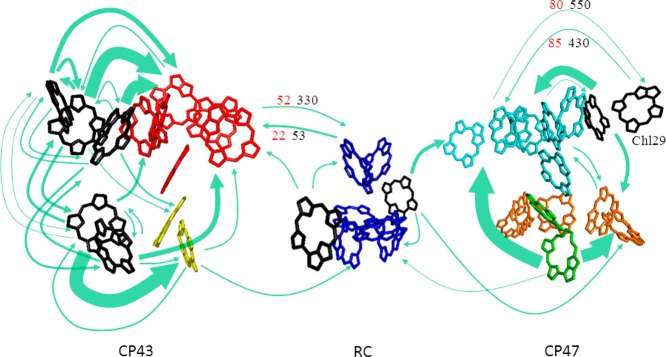
Figure 8.

Arrows show important interdomain energy-transfer paths, whose rate constants at 77 K exceed 10 ns–1. The thickness of an arrow is proportional to the square root of the transfer rate constant at 77 K between domains connected by the arrow. Two examples of highly temperature-dependent transfer paths are indicated with their disorder averaged inverse rate constants in unit of picoseconds at 77 K (red) and 5 K (black). Chls (and Pheos) in blue, orange, green, cyan, yellow, and red belong to the domains 1–6, respectively. Isolated Chls are shown in black.
