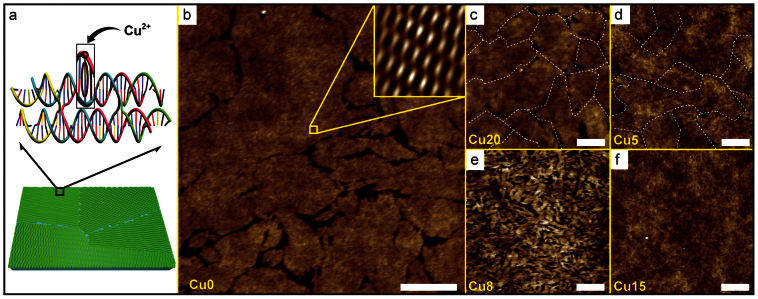
Figure 1. Schematic diagram and AFM images of M-DNA thin films.

(a) Schematic view of DNA double-crossover (DX) crystal fabrication by the substrate-assisted growth (SAG) method. Schematic diagrams reveal the DNA DX polycrystals on piranha-treated glass (PG) substrate and DX unit motif. In magnified duplex in DX motif, black circles are sites for Cu2+ coordination. (b) AFM image of DNA without the Cu2+ (Cu0). The inset in the top right is the noise-filtered 2D spectrum image (scan size, 50 × 50 nm2) by fast Fourier transform which shows the periodicity of the thin films. (c) The DNA thin films with 20 mM [Cu2+] (Cu20) (the Cu2+ was added after annealing). (d–f) AFM images of the DNA with Cu2+ ions of concentration 5, 8 and 15 mM (Cu5, Cu8, and Cu15 respectively) (the Cu2+ was added before annealing). Scale bars in all AFM images are 500 nm.
