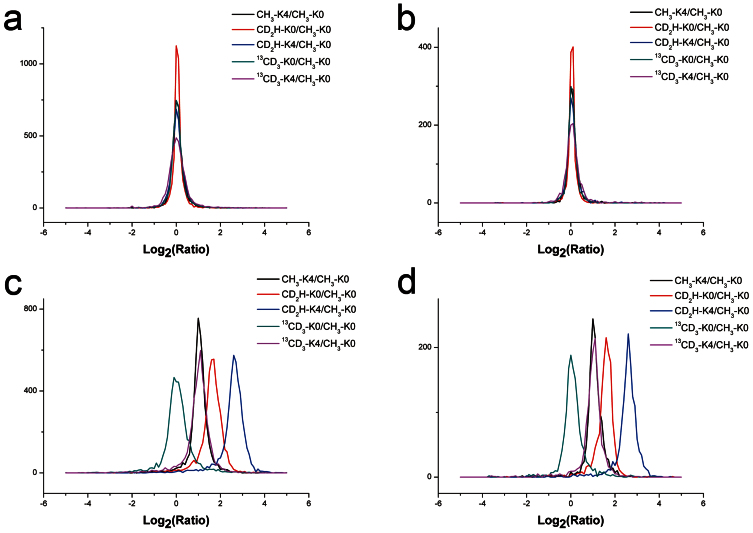
Figure 2. Log2 ratios distribution of (a, c) unique peptides and (b, d) distinct proteins obtained by quantitative proteome analysis of six HeLa cell samples in one SCX-RP 2D LC-MS/MS analysis using six-plex isotope labeling strategy.
Lysine C was used as digestion enzyme. (a, b) six HeLa cell samples (from two culture plates) were mixed with 1:1:1:1:1:1 ratio, most of the Log2 ratios are closed to 0; (c, d) six HeLa cell samples (from six culture plates) were mixed with 1:2:3:6:1:2 ratio. All the distributions for peptides and proteins are normal and symmetric around the theoretical ratios.

