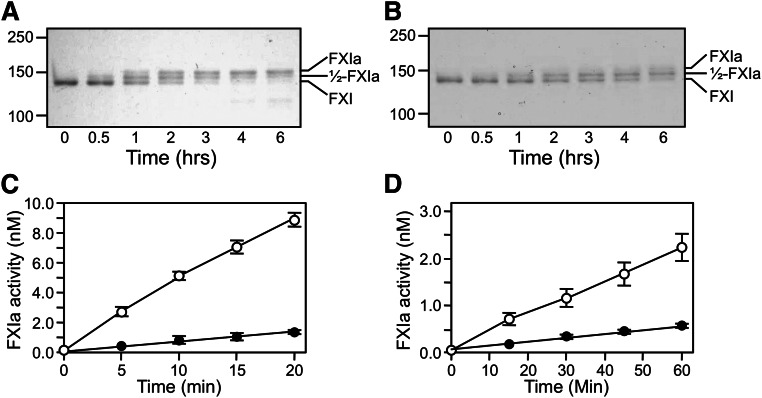
Figure 4.
Activation of plasma fXI. (A-B) Plasma fXI (600 nM) was incubated at 37°C with (A) 60 nM fXIIa or (B) 600 nM α-thrombin. Samples of each reaction were quenched in nonreducing sample buffer at the indicated times and size fractionated on 6% polyacrylamide-SDS gels. Positions for markers and protein standards for fXI, fXIa, and 1/2-fXIa are indicated. (C-D) Activation of 100 nM fXI (white circles) or 200 nM 1/2-fXIai (black circles) by (C) fXIIa (10 nM) or (D) α-thrombin (50 nM). At various times, samples were tested for enzymatic activity by measuring cleavage of the chromogenic substrate S2366 (500 μM), as described in the Methods section. Error bars represent 1 standard deviation. The concentration of 1/2-fXIai was 200 nM in the activation assay to generate sufficient signal to detect in the chromogenic substrate assay. Reactions performed with 100 nM 1/2-fXIai would have slopes 1/2 as great as those for the progress curves shown.

