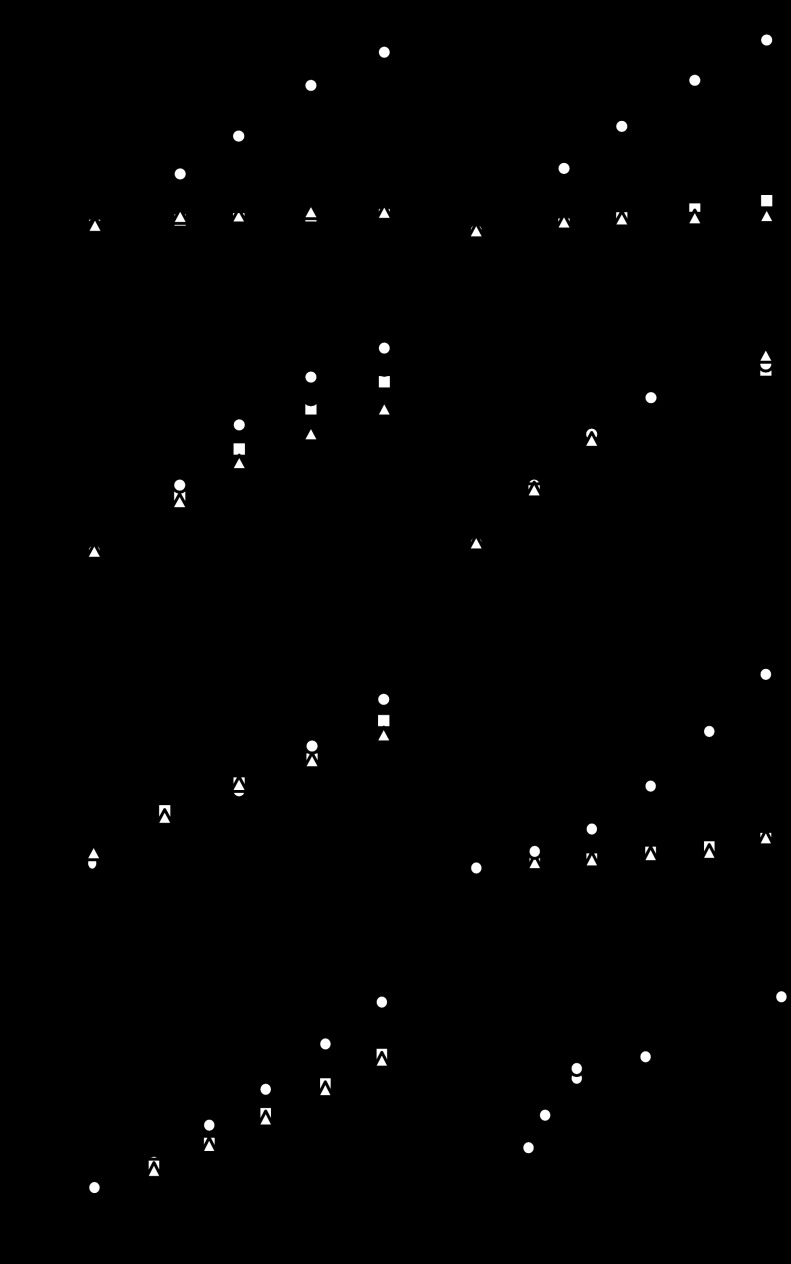
Figure 5.
Activation of fXI. (A-D) fXIWT (○), fXIC321S (●), fXIC321S,L284A (□), or fXIC321S,I290A (△), 200 nM subunits for each protein, were incubated with fXIIa at (A) 5 nM, (B) 10 nM, (C) 30 nM, or (D) 100 nM concentration. (E) FXI species in panels A-D (200 nM subunits) activated by 50 nM α-thrombin. (F-G) Activation of fXIWT (○), fXIC321S,L284A (□), or fXIC321S,I290A (△), 120 nM subunits each, incubated with (F) 3 nM fXIIa or (G) 3 nM α-thrombin in the presence of 4 μM poly-P. For panels A through G, samples of reactions were tested at various times for fXIa activity by measuring cleavage of S2366 (500 μM). (H) Michaelis–Menten nonlinear, least squares analysis of the substrate concentration dependence of fXIWT subunit activation by 3 nM α-thrombin in the presence of 4 μM poly-P. For all panels, error bars show 1 standard deviation.

