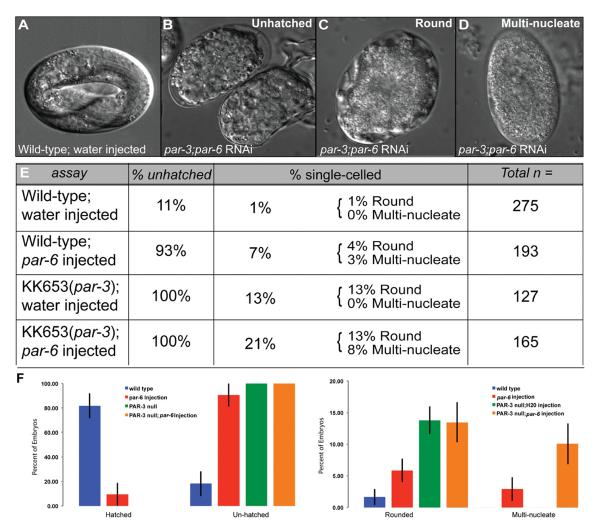
Fig. 2. Phenotypes observed in double par-3 mutant and PAR-6 RNAi-depleted embryos.
Depletion of both anterior PAR proteins (PAR-3 and PAR-6) yields a smaller brood size and a variety of embryonic lethal phenotypes. The total number of embryos from each particular assay was quantified (Total n). These embryos were first divided into groups based on gross embryonic phenotypes observed: wild type (hatched) and unhatched embryos. Unhatched embryos are embryos that did not arrest at the one-cell stage but arrested later in development. Of the wild type embryos injected with water, 11% of them did not hatch and 89% of them developed normally (A). For the par-6 injected, par-3 mutant and par-3 mutant; par-6 injected embryos their percent lethality was between 93 and 100%. A majority of these embryos resembled (B), where the embryos died at later stages of development and did not hatch (i.e., unhatched). All of the unhatched embryos that did not die at later stages in development, we identified these embryos as having a single-celled phenotype (% single-celled). Of the wild-type; par-6 injected animals, 7% of the unhatched embryos were single-celled. Of the KK653 (par-3; water injected animals, 13% of the unhatched embryos were single-celled. Of the par-3; par-6 RNAi-treated embryos, 21% of these unhatched embryos arrested at the one-cell stage and were either (C) round or (D) multinucleate. It is not clear what percentage of the sickly embryos in (C) were also multinucleate. (E) Table showing the percentages of embryos with particular embryonic phenotypes. The percentage of unhatched column designates the percent of embryonic lethality for the total number of embryos from all four experiments. Of the lethal embryos observed, we then calculated the percentage of those embryos that were multinucleate (percentage of single-celled column). Total n is the total number of embryos from multiple experiments (four each). (F) These graphs are a representation of the average percentage of each phenotype observed (hatched, unhatched, rounded, multinucleate) in the experimental replicates (four times). Each phenotype was quantified as a percentage of each individual experiment and then averaged together. Error bars indicate standard error. The percentages are similar to that of the table in (E), but this graph conveys the reproducibility of the phenotypes.

