Abstract
The authors attempt to establish the relative biological effectiveness (RBE) calculation for designing therapeutic proton beams on the basis of microdosimetry. The tissue-equivalent proportional counter (TEPC) was used to measure microdosimetric lineal energy spectra for proton beams at various depths in a water phantom. An RBE-weighted absorbed dose is defined as an absorbed dose multiplied by an RBE for cell death of human salivary gland (HSG) tumor cells in this study. The RBE values were calculated by a modified microdosimetric kinetic model using the biological parameters for HSG tumor cells. The calculated RBE distributions showed a gradual increase to about 1cm short of a beam range and a steep increase around the beam range for both the mono-energetic and spread-out Bragg peak (SOBP) proton beams. The calculated RBE values were partially compared with a biological experiment in which the HSG tumor cells were irradiated by the SOBP beam except around the distal end. The RBE-weighted absorbed dose distribution for the SOBP beam was derived from the measured spectra for the mono-energetic beam by a mixing calculation, and it was confirmed that it agreed well with that directly derived from the microdosimetric spectra measured in the SOBP beam. The absorbed dose distributions to planarize the RBE-weighted absorbed dose were calculated in consideration of the RBE dependence on the prescribed absorbed dose and cellular radio-sensitivity. The results show that the microdosimetric measurement for the mono-energetic proton beam is also useful for designing RBE-weighted absorbed dose distributions for range-modulated proton beams.
Keywords: Microdosimetry, proton beam therapy, TEPC, microdosimetric kinetic model, RBE
INTRODUCTION
Charged particle beams can deliver a relatively high dose to a target volume deeply seated in a patient's body better than conventional photon beams can, by means of their dose distribution along a Bragg curve [1]. Cancer therapy with high-energy proton beams was started at the Lawrence Berkeley National Laboratory in the United States in 1954. To date, proton beam therapy has been performed as a part of modern radiotherapy at about 30 facilities in many countries, and the number of new proton facilities is rapidly increasing around the world.
In particle radiation therapy, it is essential to calculate not only the absorbed dose but also the biological effect, which is often expressed by relative biological effectiveness (RBE). Most proton treatment facilities have adopted the constant RBE of 1.1 in clinical use [2, 3]. That means protons are assumed to be 10% more effective than reference photons under any beam conditions, because the accurate measurement and calculation of the RBE have been difficult due to the complex dependence of biological effects on the dose level, radiation quality, biological endpoint and cellular conditions. However, many biological experiments indicate that the RBE of low-energy protons with high linear energy transfer (LET) is higher than that of high-energy protons with low LET [4, 5]. Paganetti et al. calculated the RBE for proton beams using the biological weighting function based on the microdosimetric lineal energy spectra [6]. Wilkens and Oelfke proposed a simple phenomenological RBE model for the fast calculation of proton RBE from dose-averaged LET in treatment planning [7]. Kundrát presented the probabilistic two-stage model with model parameters dependent on the particle type and LET value [8].
The microdosimetric approach is useful for assessing biological effects on the basis of the energy deposition patterns on microscopic targets [9], and it was applicable to estimate the RBE for particle treatment beams [10–13]. The microdosimetric kinetic model (MKM) was developed by Hawkins to calculate cell survival curves for various types of radiation beam [14]. The MKM was then modified to derive the RBE for particle- and energy-modulated beams from the microdosimetric spectrum measured using the tissue-equivalent proportional counter (TEPC) [15]. The MKM was often used for calculating the RBE distributions in combination with the Monte Carlo calculation for photon beams [16], passive carbon ion beams [17, 18] and scanning carbon ion beams [19].
The purpose of this study was to derive an RBE-weighted absorbed dose distribution from microdosimetric spectra measured by the TEPC by means of the modified MKM. The radiation-induced cell death of human salivary gland (HSG) tumor cells was adopted as an endpoint to calculate the RBE, in accordance with the RBE model for carbon ion therapy at the National Institute of Radiological Sciences (NIRS) in Japan [20]. The RBE-weighted absorbed dose distribution of range-modulated proton beams was derived with the mixing calculation from the measured quantities for a mono-energetic proton beam before the modulation. The mixing calculation method was examined by comparison with the direct TEPC measurement of the range-modulated beam. Some depth–dose distributions with conformal RBE-weighted absorbed doses in the spread-out Bragg peak (SOBP) regions were designed to demonstrate the dependence of RBE on the SOBP width, the prescribed dose and the tissue response (linear-quadratic α/β ratio for X-rays), in assuming that range modulation could be performed by the active beam scanning method or the layer-stacking method.
MATERIALS AND METHODS
Microdosimetric lineal energy measurement
The microdosimetric spectra of proton beams were measured using a proportional counter (LET-1/2; Far West Technology, Inc., Goleta, CA, USA). The sensitive volume of the counter was nominally a sphere of 12.7 mm diameter, around which a spherical wall of A-150 tissue-equivalent plastic (thickness 1.27 mm) was situated. The wall was housed in an aluminum shell (thickness 0.178 mm) to maintain a proportional gas under low pressure. The propane-based tissue-equivalent gas (p-TEG; 54.6% C3H8, 40.16% CO2 and 5.26% N2, by volume) was enclosed with a pressure of 4.4 kPa in the counter to simulate the energy imparted to a spherical tissue with a unit density of 1.0 μm diameter. The electric impulse from the counter entered a preamplifier (model142B; ORTEC, Oak Ridge, TN, USA), and then the pre-amplified output signal was divided to enter three linear amplifiers (model 572/671; ORTEC) with three gains of 2, 30 and 450 times to realize a wide measurement range and fine energy resolution. These signals were stored in multi-channel analyzers (MCA8000A; AMPTEK, Bedford, MA, USA). A calibration pulser was used to examine the linearity between the pulse height of the pre-amplifier output and the channel and to relate those channels of the three spectra. The bin sizes of energy imparted were 3.0, 45 and 671 eV for high-, middle- and low-gain spectra, respectively. The lowest levels of energy imparted were 15 eV, 4.4 keV and 67 keV for high-, middle- and low-gain spectra, respectively. Dead times were suppressed to less than 1%.
Microdosimetry for proton beams
The TEPC measurement was performed for a 155-MeV mono-energetic proton beam and a therapeutic proton beam with a nominal SOBP width of 6 cm. Figure 1 shows a schematic layout of the measurement in the proton treatment room with the rotating gantry in the Proton Medical Research Center of the University of Tsukuba. The gantry angle was set at 270° to use the horizontal beam in the TEPC measurement with a water phantom. The proton beam was laterally broadened by the double-scattering method before entering the treatment room. The field size was about 20 cm in diameter. A ridge filter composed of an array of metallic ridge bars was used to make the SOBP beam. Each ridge bar was designed to be a specific stepwise shape so that the absorbed dose was flattened in the SOBP region.
Fig. 1.
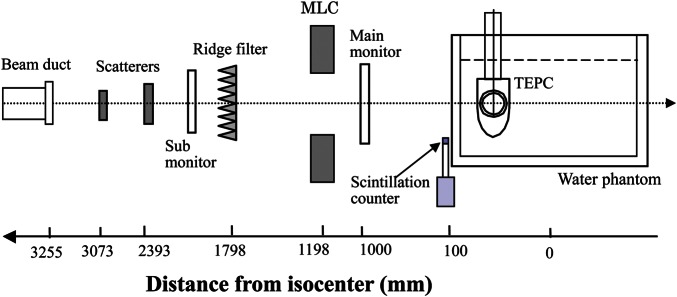
Schematic layout of the irradiation system for the therapeutic proton beam and TEPC measurement.
Microdosimetric spectra were measured by the TEPC at various depths in the water phantom. The count rate of the TEPC was reduced to about 104 counts/s by reducing the beam intensity. The radiation quality of the low-intensity beam was assumed to be the same as that of the usual beam intensity. A main dose monitor of a parallel-plate ionization chamber was positioned in the beam line, but it was not available in the TEPC measurement due to the very low intensity of the beam. Thus, a small scintillation detector was placed on the edge of the water phantom to count an area of protons near the edge of the low-intensity beam.
RBE calculation by the modified MKM
The RBE-weighted absorbed dose was defined as a product of the absorbed dose and RBE for cell death of in vitro HSG tumor cells. The HSG tumor cells have been used to determine the RBE in carbon ion beams as the standard reference cell line [20, 21] and to research the RBE in proton and carbon ion beams [22–24]. The RBE value was calculated from dose–survival curves of radiation of interest and reference photon radiation. The surviving fraction, S, was calculated from the lineal energy spectrum by the modified MKM with the model parameters of the HSG tumor cells (α0 = 0.13 Gy−1, β = 0.05 Gy−2, rd = 0.42 µm and y0 = 150 keV/μm) as follows [15, 25]:
| (1) |
| (2) |
where D is the absorbed dose, ρ is the density of tissue assumed to be ρ =1 g/cm3, f(y) is the probability density of lineal energy, y, y* represents the saturation-corrected dose-mean lineal energy and β is the constant value of 0.05 Gy−2.
The RBE value of HSG tumor cells with S was calculated as follows:
| (3) |
where DS and DS,R are the doses necessary for S by radiation of interest and reference radiation, respectively. For this RBE calculation, the 200-kV X-rays were used as the reference radiation, which had the α value of 0.19 Gy−1 and the β value of 0.05 Gy−2 in the linear quadratic model [15]. Then, the RBE-weighted absorbed dose, DRBE, for HSG tumor cells is defined as follows:
| (4) |
where the unit of Gy (RBE) was used for the DRBE value.
The model parameters given above were assumed to be radiation-independent values for HSG tumor cells, and originally obtained to calculate RBE values for HSG tumor cells from microdosimetric spectra measured by the TEPC. Meanwhile, the different model parameters were used in other papers [19, 26] since those were adjusted to calculate survival curves from averaged energies imparted to the cylindrical volume using amorphous track structure models.
Mixing calculation for range-modulated beams
The therapeutic SOBP beam is made by a superposition of many range-modulated Bragg curves. The mixed absorbed dose, Dm, and mixed y* value, y*m, of the range-modulated beam were calculated from those of the mono-energetic beams by the following mixing calculation [25]:
| (5) |
 |
(6) |
where di(x) and y*(x) are the absorbed dose and y* value, respectively, at a depth of x in the mono-energetic beam, and ri is the weighting factor required for the superimposition with the shifted depth of si. The survival fraction and the RBE-weighted absorbed dose in the range-modulated beam were calculated from the absorbed dose and y* distributions in the mono-energetic beam by Eqns (1)–(6).
Cell irradiation
The HSG tumor cells (JCRB1070: HSGc-C5) were used in the measurement of survival curves. The cells were seeded to about 5 × 10⁵ cells per 25-cm2 culture bottle (Nunc, Roskilde, Denmark) at the time of irradiation. Eagle's minimum essential medium (E-MEM) supplemented with 10% fetal bovine serum (FBS; JRH Biosciences, Lenexa, KS, USA) and antibiotics (penicillin and streptomycin) was used at cell culture. Seven bottles were prepared to obtain one survival curve. One bottle was not irradiated, to ascertain the plating efficiency of the series of colony formation experiments, and the other bottles were irradiated once by the therapeutic proton beam with different absorbed doses. Survival curves of the HSG tumor cells were measured at four depths of entrance, 5 mm in the back of the proximal SOBP peak, at the center of the SOBP and 5 mm short of the distal SOBP peak in the therapeutic proton beam.
After being exposed to radiation, the cells in the irradiated bottles were harvested by trypsinization and counted using a cell counter (Coulter, Z-1; Beckman Coulter Inc., Brea, CA, USA). Then the cells were diluted with E-MEM and plated onto three dishes of 6-cm diameter (Falcon, 3002; BD, Franklin Lakes, NJ, USA) to yield about 100 colonies per dish. After 2 weeks of incubation, the colonies were fixed and stained. Colonies containing more than 50 cells were counted as surviving colonies. The average plating efficiency of control experiments was about 81%.
RESULTS
Microdosimetric spectra
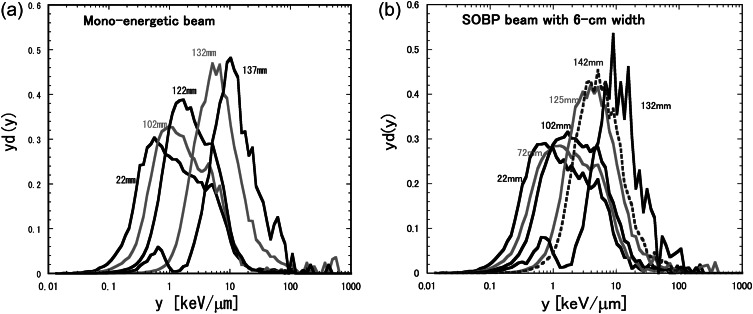
The microdosimetric lineal energy spectrum, yd(y), in the semi-log representation is the standard representation of a microdosimetric spectrum. Figure 2 shows typical yd(y) spectra measured by the TEPC at typical depths in the water phantom for 155-MeV proton beams of the mono-energetic beam and the typical treatment beam with the 6-cm nominal SOBP width. The lineal energies of the proton beam ranged from 0.1 to 20 keV/μm around the entrance, and from 1 to 100 keV/μm around the Bragg peak. The yd(y) spectra shifted to higher y events with the depth up to the maximum beam range because of the decreased proton energy and the increased average LET of the proton.
Fig. 2.
Microdosimetric spectra of lineal energy, yd(y), measured using the TEPC at typical depths in the water phantom for the 155-MeV proton beams: (a) mono-energetic beam; (b) typical treatment beam with a 6-cm nominal SOBP width.
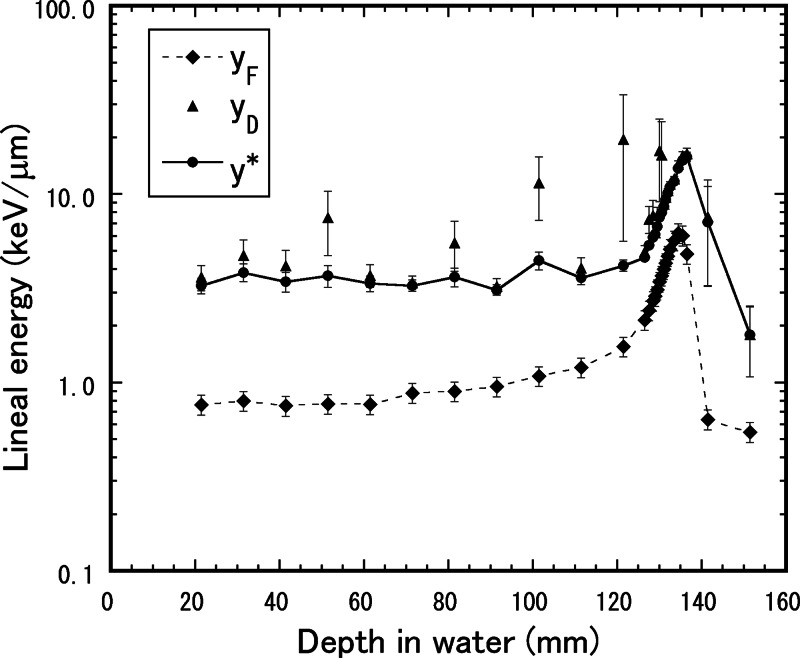
Figure 3 shows the frequency-mean lineal energy, yF, dose-mean lineal energy, yD, and saturation-corrected dose-mean lineal energy, y*, with the saturation parameter y0 = 150 keV/μm as a function of the depth in water, measured by the TEPC for the mono-energetic 155-MeV proton beam. The yD values measured by the TEPC often have large uncertainty because they are significantly affected by even a few events with large lineal energy. The high-energy proton sometimes undergoes a nuclear reaction in material. The nuclear reaction may produce recoil neutrons and radionuclides, which can cause enormously large lineal energy. On the other hand, the y* values were relatively stable results, because of oversaturation with the effect of lineal energy larger than 150 keV/μm along with the radiobiological overkill effect. The events beyond the proton maximum range are also attributed to the neutrons and gamma-rays emitted from the radionuclides [13].
Fig. 3.
Frequency–mean lineal energy, yF, dose–mean lineal energy, yD, and saturation-corrected dose–mean lineal energy with the saturation parameter y0 = 150 keV/μm, y*, as a function of the depth in water, measured by the TEPC for the mono-energetic 155-MeV proton beam.
RBE-weighted absorbed dose distributions
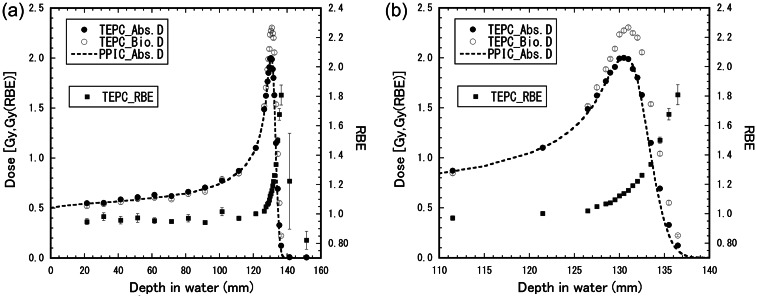
The depth–dose and depth–y* distributions were calculated from the microdosimetric spectra measured by the TEPC. Figure 4 shows the depth–dose distributions and depth–RBE distribution for the mono-energetic 155-MeV proton beam. The y* values were around 4 keV/μm in the dose plateau region from the entrance to the depth of 1 cm short of the dose peak, and they increased sharply to about 18 keV/μm beyond 6 mm after the dose peak. The RBE values obtained by the TEPC measurement were almost constant from the entrance to the depth of 1 cm short of the dose peak, and they increased sharply with the depth in water around the dose peak. The calculated RBE values were 0.95 ± 0.02 at the entrance (22 mm), 1.05 ± 0.01 at the proximal 90% dose depth (128 mm), 1.16 ± 0.01 at the dose peak (131 mm), 1.22 ± 0.01 at the distal 90% dose depth (132 mm), 1.30 ± 0.02 at the 50% dose depth (133 mm) and 1.74 ± 0.07 at the 10% dose depth (136 mm). The uncertainties in the RBE value were calculated from the uncertainties in the statistical uncertainties of the absorbed dose and the y* value. The calculated RBE values were below 1.0 in the plateau region up to about 100 mm since the y* values measured in the region were less than about 4.3 keV/μm corresponding to reference X-rays [15].
Fig. 4.
Depth–dose distributions and depth–RBE distribution for the mono-energetic 155-MeV proton beam. Plots represent the TEPC measurement. The dashed line shows the measurement by a plane-parallel ionization chamber. The right figure shows an enlarged view around the beam range of the left figure.
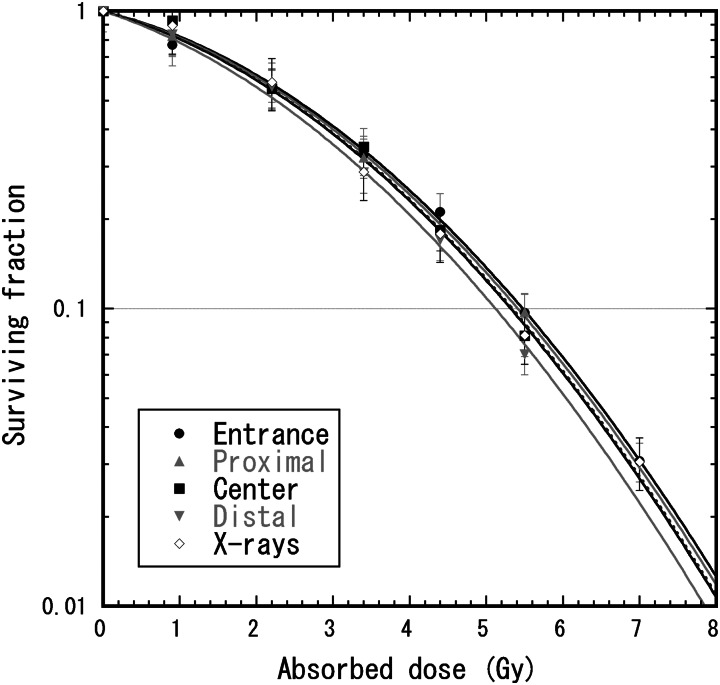
Figure 5 shows survival curves of the HSG tumor cells for the therapeutic proton beams with 6-cm nominal SOBP width. The survival curve for the 200-kV X-rays [16] was also plotted to derive experimental RBE values for the proton beams. If these survival curves were fitted by the linear quadratic model, then the fitted α and β values were, respectively, 0.157 Gy−1 and 0.048 Gy−2 at the entrance, 0.164 Gy−1 and 0.048 Gy−2 at 5 mm in the back of the proximal SOBP peak, 0.139 Gy−1 and 0.056 Gy−2 at the center of the SOBP, 0.141 Gy−1 and 0.062 Gy−2 at 5 mm short of the distal SOBP peak in the therapeutic proton beam and 0.196 Gy−1 and 0.044 Gy−2 for 200-kV X-rays. However, fitting two parameters with these limited survival data would cause large errors because of the anticorrelation between α and β values. Thus, only α values were fitted with a constant β value in analogy with the MKM calculation to calculate RBE values. The α values fitted with the constant β value of 0.05 Gy−2 were 0.147 ± 0.005 Gy−1 at the entrance, 0.155 ± 0.004 Gy−1 at 5 mm at the back of the proximal SOBP peak, 0.167 ± 0.009 Gy−1 at the center of the SOBP and 0.194 ± 0.007 Gy−1 at 5 mm short of the distal SOBP peak in the therapeutic proton beam and 0.164 ± 0.008 Gy−1 for 200-kV X-rays.
Fig. 5.
Survival curves of the HSG tumor cells for 155-MeV proton beams with the 6-cm nominal SOBP width and 200-kV X-rays. The cells were irradiated at four depths of entrance, 5 mm in the back of the proximal SOBP peak, at the center of the SOBP, and 5 mm short of the distal SOBP peak in the therapeutic proton beam. Polyethylene blocks were used for changing the water-equivalent depth. The lines represent the curves fitted by the liner quadratic model with the constant β value of 0.05 Gy−2.
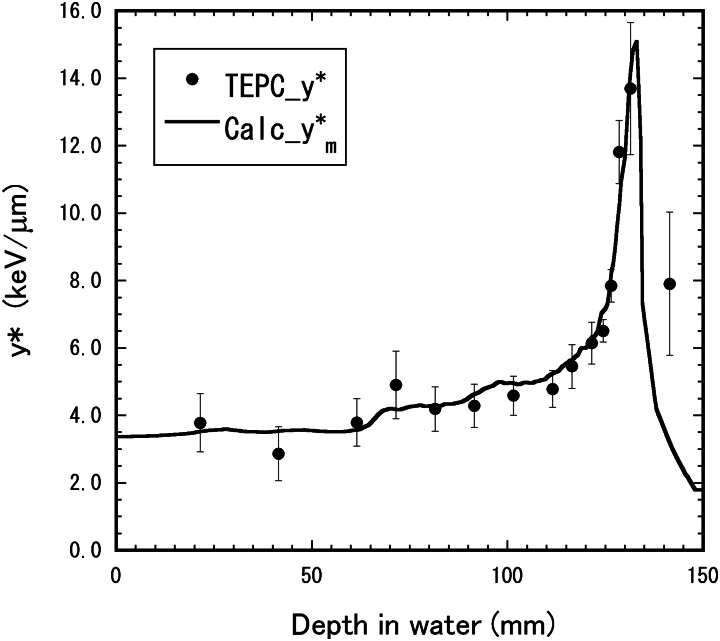
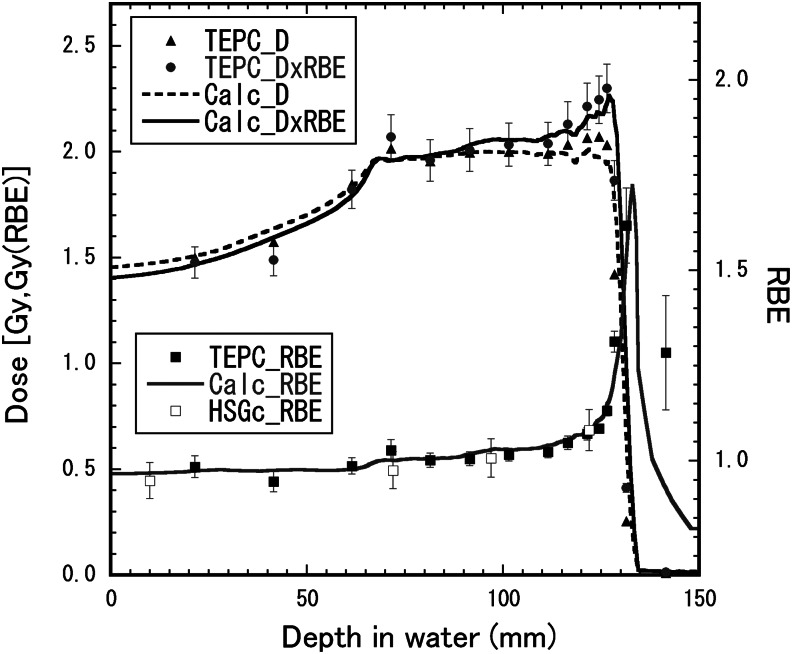
Figure 6 shows depth–y* distributions for the 155-MeV proton beam with the 6-cm nominal SOBP width. Figure 7 shows depth–dose distributions and the depth–RBE distribution for the same beam. The distributions calculated by the mixing calculation with Eqn (6) from the depth–y* distribution for the mono-energetic beam were compared with those directly derived by Eqn (2) from the microdosimetric spectra measured in the SOBP beam. The directly derived RBE values agreed well with the calculated RBE distribution within the uncertainties, except for the depth beyond the maximum proton range. The calculated RBE values were 0.97 ± 0.02 at the entrance (22 mm), 1.00 ± 0.03 at the SOBP proximal region (73 mm), 1.03 ± 0.03 at the SOBP center (98 mm), 1.09 ± 0.02 at the SOBP rear region (123 mm) and 1.23 ± 0.09 at the beam range of the 90% dose (128 mm). The experimental RBE values were 0.95 ± 0.05 at the entrance, 0.98 ± 0.05 at the SOBP proximal region, 1.01 ± 0.05 at the SOBP center and 1.08 ± 0.06 at the SOBP rear region
Fig. 6.
Depth–y* distribution for the 155-MeV proton beam with the 6-cm nominal SOBP width. The closed circles represent the y* values directly measured in the SOBP beam. The solid lines show the distribution calculated by the mixing calculation with Eqn (6) from the depth–dose and depth–y* distributions measured in the mono-energetic beam.
Fig. 7.
Depth–dose distributions and depth–RBE distributions for the 155-MeV proton beam with the 6-cm nominal SOBP width. The closed triangles, diamonds and squares represent the absorbed dose, the RBE-weighted absorbed dose and the RBE, respectively, directly derived by Eqn (2) from the microdosimetric spectra measured in the SOBP beam. The open squares represent the RBE obtained by the cell irradiation of the HSG tumor cells. The solid lines show the distributions calculated by the mixing calculation with Eqn (6) from the depth–dose and depth–y* distributions measured in the mono-energetic beam.
Typically, the reproducibility of the experimental survival fraction was poorer than that of the physical dose measurements. Some possible reasons for changing the survival fraction are unexpected changes of the radio-sensitivity of the HSG cells, the compositions of nutrient medium, culture conditions, and so on. It was assumed that the RBE value was a relatively reproducible result even though the reference survival curves changed, within about ± 5% from our previous experience.
Designed depth–dose distributions
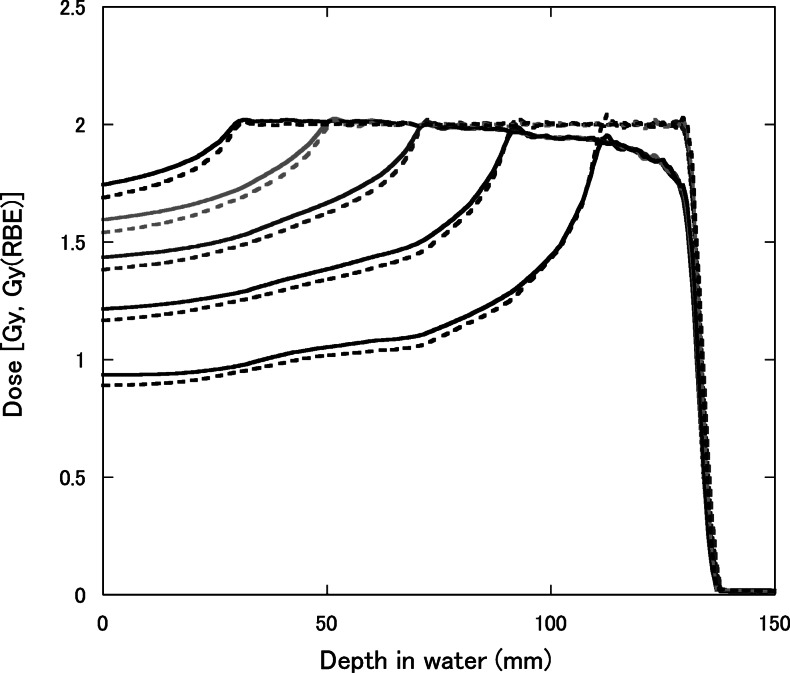
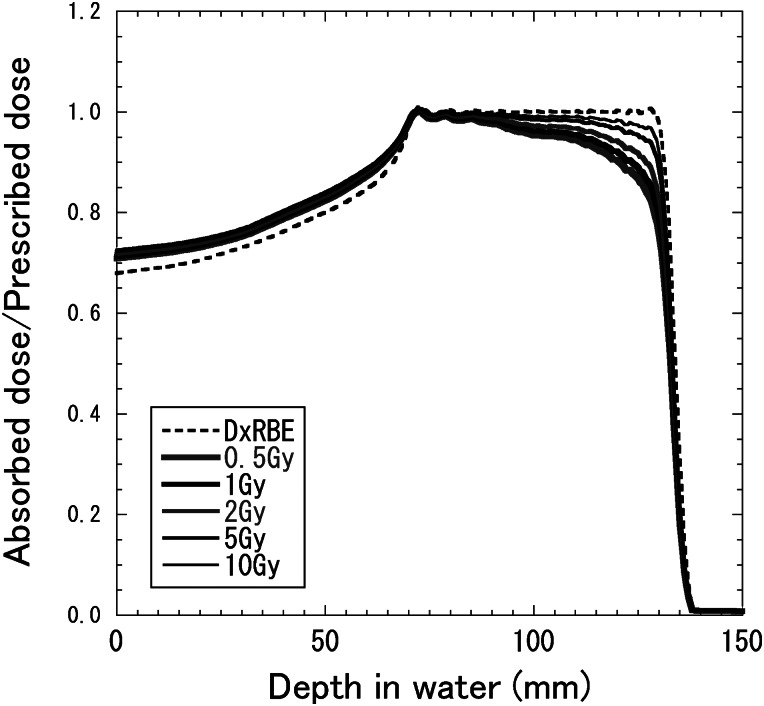
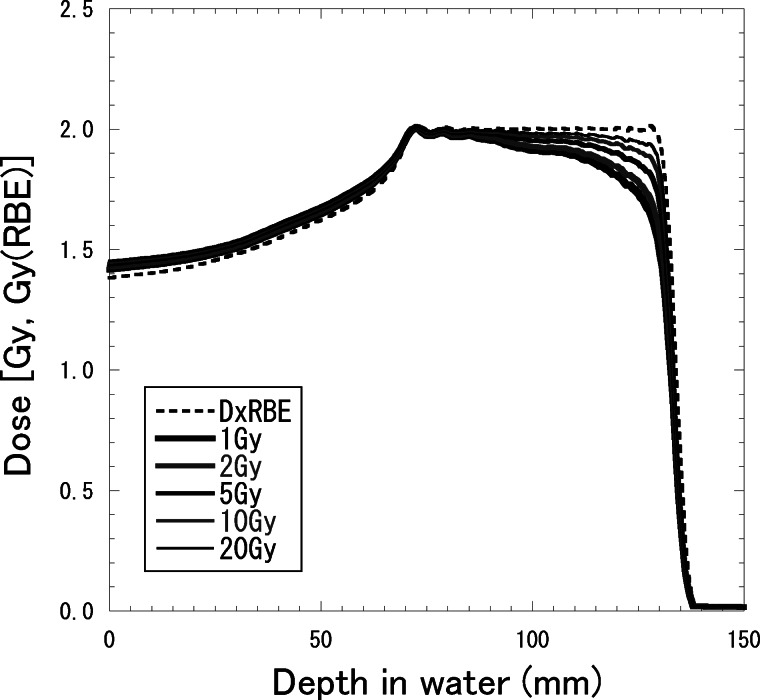
Figure 8 shows depth–dose distributions for 155-MeV proton beams with the SOBP widths of 2, 4, 6, 8 and 10 cm, which were designed to be constant RBE-weighted absorbed doses of 2 Gy (RBE) in each SOBP region. The RBE increased with the depth and was almost dependent on the residual range in the SOBP region at any SOBP width. Therefore, to have a flat RBE-weighted absorbed dose distribution, the absorbed dose must decrease with the depth in the SOBP region. It is well known that the RBE is dependent on the absorbed dose and radio-sensitivity for the irradiation target. Figure 9 shows calculated depth–dose distributions for the 155-MeV proton beams with a 6-cm SOBP width for various prescribed doses, which were designed to be constant RBE-weighted absorbed doses of 0.5, 1, 2, 5 or 10 Gy (RBE) in the SOBP region. Figure 10 shows depth–dose distributions for the 155-MeV proton beams with a 6-cm SOBP width for various α/β ratios of 1, 2, 5, 10 and 20 Gy for 200-kV X-rays with the constant β value of 0.05 Gy−2, which were calculated in the same manner as in a previous study [25]. They were designed to be constant RBE-weighted absorbed doses of 2 Gy (RBE) in the SOBP region.
Fig. 8.
Depth–dose distributions for 155-MeV proton beams with the SOBP widths of 2, 4, 6, 8 and 10 cm, designed to be a constant RBE-weighted absorbed dose of 2 Gy (RBE) at the center of the SOBP. The solid and dashed lines represent the absorbed dose and RBE-weighted absorbed dose, respectively.
Fig. 9.
Depth–dose distributions for 155-MeV proton beams with a 6-cm SOBP width for the cases of RBE-weighted absorbed doses of 0.5, 1, 2, 5 or 10 Gy (RBE), designed to be a constant RBE-weighted absorbed dose in the SOBP region. The solid and dashed lines represent the absorbed dose and RBE-weighted absorbed dose, respectively.
Fig. 10.
Depth–dose distributions for 155-MeV proton beams with a 6-cm SOBP width for the cases of α/β ratios of 1, 2, 5, 10 and 20 Gy for X-rays with the constant β value of 0.05 Gy−2, designed to be a constant RBE-weighted absorbed dose of 2 Gy (RBE) in the SOBP region. The solid and dashed lines represent the absorbed dose and RBE-weighted absorbed dose, respectively.
The larger the absorbed dose or the larger the α/β ratio for X-rays was, the lower the RBE derived by the modified MKM calculation, notably in the SOBP region. Therefore, the absorbed dose distribution needs to be optimized depending on the prescribed absorbed dose and cellular – to result in a flat RBE-weighted absorbed dose distribution in the SOBP region.
DISCUSSION
The RBE distributions calculated from the TEPC measurement by the modified MKM showed a gradual increase to about 1 cm short of a beam range and a steep increase around the beam range for both the mono-energetic and SOBP proton beams. These results were roughly consistent with the calculated RBE distributions reported in several previous papers [6, 7, 27]. Matsuura et al. [28] reported that the experimental RBE value of HSG tumor cells at the Bragg peak for the mono-energetic 235-MeV proton beam was 1.18 ± 0.07 times higher than that at the plateau region and nearly independent of the dose rate. The extension of the beam range by about 1 mm was also observed, matching what Carabe et al. reported [29]. However, a systematical uncertainty in the water-equivalent depth of about ±1.5 mm was estimated in consideration of the spherical wall and placement accuracy of the TEPC in the water phantom. A miniature TEPC would be effective for measuring microdosimetric spectra around the beam range with higher resolution [27].
We validated the calculation method to derive the RBE-weighted absorbed dose distribution of the range-modulated proton beam from the microdosimetric spectra of the mono-energetic proton beam with the initial energy of 155 MeV. The result indicates that the microdosimetric measurement is available not only to evaluate the RBE-weighted dose distribution for designed SOBP beams, but also to design new SOBP beams from elemental mono-energetic proton beams.
The mixing calculation in this study assumed that the y* value and absorbed dose distribution of the same residual range were approximately unchanged by the range shift. Meanwhile, the RBE distribution is known to depend on the initial beam energy. The larger the initial beam energy was, the smaller the maximum RBE around the beam range was [6]. Therefore, if different initial beam energies are used for designing the RBE-weighted dose distribution, the y* value and absorbed dose distribution should be measured or calculated with respect to each initial beam energy.
The change tendency of the RBE distribution dependence on the physical radiation quality is thought to be approximately common to that of other human cell lines. The variable RBE calculated by the modified MKM has been applied to scanning carbon ion treatment planning [19]. In the future, the variable RBE calculation will be important to achieve more high-precision proton therapy. An active beam scanning method and layer-stacking method would make it possible to irradiate treatment beams with consistently flat RBE-weighted absorbed dose distribution in biologically modulated particle therapy.
Incidentally, the absolute RBE value obtained for the in vitro HSG tumor cells should not be simply applied in clinical situations, because it would be greatly influenced by cellular characteristics, circumstance, culture solution, and so on. Therefore, it is difficult in this study to discuss an absolute dose prescription or a clinical RBE for proton beam therapy. Moreover, the absolute RBE value is also dependent on the choice of reference radiation type. The survival curve of a photon beam depends on the photon energy spectrum. For example, the absorbed doses of 10% survival level for the HSG tumor cells were 5.3 Gy for 200-kV X-rays, 5.9 Gy for 60Co gamma-rays, and 6.1 Gy for 6-MV X-rays [30]. Therefore, the RBE values calculated at a 10% survival level using the 60Co gamma-rays and 6-MV X-rays as reference radiation are about 11% and 15% larger, respectively, than that using the 200-kV X-rays. Therefore, this study result should be used for improving only relative dose distribution in a proton beam treatment planning system.
In conclusion, we calculated the RBE of HSG tumor cells by the modified MKM using microdosimetric spectra measured by the TEPC for 155-MeV proton beams. The calculated RBE values were partially compared with the biological experiment with HSG tumor cells irradiated by the proton SOBP beam except around the distal peak, though there was the causeless shift of the survival curve for reference X-rays. The mixing calculation was effective to derive the RBE-weighted absorbed dose distribution of the range-modulated proton beam from the microdosimetric spectra of the mono-energetic proton beam with the same initial proton energy. The modified-MKM calculation showed a sharp increase of the RBE of about ±1 cm around the proton beam range, though the RBE values around the dose peak were not confirmed by cell irradiation. The absorbed dose distributions to planarize the RBE-weighted absorbed dose were calculated in consideration of the RBE dependence on the prescribed absorbed dose and cellular radio-sensitivity. We expect that this method would make it possible to calculate the RBE-weighted dose distributions easily with the microdosimetric quantities for various irradiation conditions in a future treatment planning system.
ACKNOWLEDGEMENTS
This work was supported by the Japan Society for the Promotion of Science (JSPS KAKENHI 23791477). The authors wish to thank the operation staff at the Proton Medical Research Center, University of Tsukuba, for their skillful work.
REFERENCES
- 1.Wilson R-R. Radiological use of fast protons. Radiology. 1946;47:487–91. doi: 10.1148/47.5.487. [DOI] [PubMed] [Google Scholar]
- 2.Paganetti H, Niemierko A, Ancukiewicz M, et al. Relative biological effectiveness (RBE) values for proton beam therapy. Int J Radiat Oncol Biol Phys. 2002;53:407–21. doi: 10.1016/s0360-3016(02)02754-2. [DOI] [PubMed] [Google Scholar]
- 3.ICRU. Prescribing, Recording, and Reporting Proton-Beam Therapy. International Commission on Radiation Units and Measurements Report 78. 2007 Bethesda, MD. [Google Scholar]
- 4.Folkard M, Prise K-M, Vojnovic B, et al. Inactivation of V79 cells by low-energy protons, deutrons and helium-3 ions. Int J Radiat Biol. 1996;69:729–38. doi: 10.1080/095530096145472. [DOI] [PubMed] [Google Scholar]
- 5.Belli M, Cera F, Cherubini R, et al. RBE-LET relationships for cell inactivation and mutation induced by low energy protons in V79 cells: further results at the LNL facility. Int J Radiat Biol. 1998;74:501–9. doi: 10.1080/095530098141375. [DOI] [PubMed] [Google Scholar]
- 6.Paganetti H, Olko P, Kobus H, et al. Calculation of relative biological effectiveness for proton beams using biological weighting functions. Int J Radiat Oncol Biol Phys. 1997;37:719–29. doi: 10.1016/s0360-3016(96)00540-8. [DOI] [PubMed] [Google Scholar]
- 7.Wikens J-J, Oelfke U. A phenomenological model for the relative biological effectiveness in therapeutic proton beams. Phys Med Biol. 2004;49:2811–25. doi: 10.1088/0031-9155/49/13/004. [DOI] [PubMed] [Google Scholar]
- 8.Kundrát P. Detailed analysis of the cell-inactivation mechanism by accelerated protons and light ions. Phys Med Biol. 2006;51:1185–99. doi: 10.1088/0031-9155/51/5/010. [DOI] [PubMed] [Google Scholar]
- 9.Kellerer A-M, Rossi H-H. A generalized formation of dual radiation action. Radiat Res. 1978;75:471–88. doi: 10.1667/rrav17.1. [DOI] [PubMed] [Google Scholar]
- 10.Hall E-J, Kellerer A-M, Rossi H-H, et al. The relative biological effectiveness of 160MeVprotons—II Biological data and their interpretation in terms of microdosimetry. Int J Radiat Oncol Biol Phys. 1978;4:1009–13. doi: 10.1016/0360-3016(78)90013-5. [DOI] [PubMed] [Google Scholar]
- 11.Luxton G, Fessenden P, Hoffmann W. Microdosimetric measurement of pretherapeutic heavy ion beams. Radiat Res. 1979;79:256–72. [PubMed] [Google Scholar]
- 12.Menzel H-G, Pihet P, Wambersie A. Microdosimetric specification of radiation quality in neutron radiation therapy. Int J Radiat Biol. 1990;57:865–83. doi: 10.1080/09553009014550991. [DOI] [PubMed] [Google Scholar]
- 13.Coutrakon G, Cortese J, Ghebremedhin A, et al. Microdosimetry spectra of the Loma Linda proton beam and relative biological effectiveness comparisons. Med Phys. 1997;24:1499–506. doi: 10.1118/1.598038. [DOI] [PubMed] [Google Scholar]
- 14.Hawkins R-B. A microdosimetric-kinetic model for the effect of non-Poisson distribution of lethal lesions on the variation of RBE with LET. Radiat Res. 2003;160:61–9. doi: 10.1667/rr3010. [DOI] [PubMed] [Google Scholar]
- 15.Kase Y, Kanai T, Matsumoto Y, et al. Microdosimetric measurements and estimation of human cell survival for heavy-ion beams. Radiat Res. 2006;166:629–38. doi: 10.1667/RR0536.1. [DOI] [PubMed] [Google Scholar]
- 16.Okamoto H, Kohno T, Kanai T, et al. Microdosimetric study on influence of low energy photons on relative biological effectiveness under therapeutic conditions using 6 MV linac. Med Phys. 2011;38:4714–22. doi: 10.1118/1.3613152. [DOI] [PubMed] [Google Scholar]
- 17.Nose H, Kase Y, Matsufuji N, et al. Field size effect of radiation quality in carbon therapy using passive method. Med Phys. 2009;36:870–5. doi: 10.1118/1.3077490. [DOI] [PubMed] [Google Scholar]
- 18.Sato T, Watanabe R, Kase Y, et al. Analysis of cell-survival fractions for heavy-ion irradiations based on microdosimetric kinetic model implemented in the particle and heavy ion transport code system. Radiat Prot Dosim. 2011;143:491–6. doi: 10.1093/rpd/ncq484. [DOI] [PubMed] [Google Scholar]
- 19.Inaniwa T, Furukawa T, Kase Y, et al. Treatment planning for a scanned carbon beam with a modified microdosimetric kinetic model. Phys Med Biol. 2010;55:6721–37. doi: 10.1088/0031-9155/55/22/008. [DOI] [PubMed] [Google Scholar]
- 20.Kanai T, Endo M, Minohara S, et al. Biophysical characteristics of HIMAC clinical irradiation system for heavy-ion radiation therapy. Int J Radiat Oncol Biol Phys. 1999;44:201–10. doi: 10.1016/s0360-3016(98)00544-6. [DOI] [PubMed] [Google Scholar]
- 21.Furusawa Y, Fukutsu K, Aoki M, et al. Inactivation of aerobic and hypoxic cells from three different cell lines by accelerated 3He-, 12C- and 20Ne-ion beams. Radiat Res. 2000;154:485–96. doi: 10.1667/0033-7587(2000)154[0485:ioaahc]2.0.co;2. [DOI] [PubMed] [Google Scholar]
- 22.Kagawa K, Murakami M, Hishikawa Y, et al. Preclinical biological assessment of proton and carbon ion beams at Hyogo ion beam medical center. Int J Radiat Oncol Biol Phys. 2002;54:928–38. doi: 10.1016/s0360-3016(02)02949-8. [DOI] [PubMed] [Google Scholar]
- 23.Baek H-J, Kim T-H, Shin D, et al. Radiobiological characterization of proton beam at the National Cancer Center in Korea. J Radiat Res. 2008;49:509–15. doi: 10.1269/jrr.08017. [DOI] [PubMed] [Google Scholar]
- 24.Uzawa A, Ando K, Koike S, et al. Comparison of biological effectiveness of carbon-ion beams in Japan and Germany. Int J Radiat Oncol Biol Phys. 2009;73:1545–51. doi: 10.1016/j.ijrobp.2008.12.021. [DOI] [PubMed] [Google Scholar]
- 25.Kase Y, Himukai T, Nagano A, et al. Preliminary calculation of RBE-weighted dose distribution for cerebral radionecrosis in carbon-ion treatment planning. J Radiat Res. 2011;52:789–96. doi: 10.1269/jrr.11044. [DOI] [PubMed] [Google Scholar]
- 26.Kase Y, Kanai T, Matsufuji N, et al. Biophysical calculation of cell survival probabilities using amorphous track structure models for heavy-ion irradiation. Phys Med Biol. 2008;53:37–59. doi: 10.1088/0031-9155/53/1/003. [DOI] [PubMed] [Google Scholar]
- 27.De Nardo L, Moro L-D, Colautti P, et al. Microdosimetric investigation at the therapeutic proton beam facility of Catana. Radiat Prot Dosim. 2004;110:681–6. doi: 10.1093/rpd/nch111. [DOI] [PubMed] [Google Scholar]
- 28.Matsuura T, Egashira Y, Nishio T, et al. Apparent absence of a proton beam dose rate effect and possible differences in RBE between Bragg peak and plateau. Med Phys. 2010;37:3567–81. doi: 10.1118/1.3490086. [DOI] [PubMed] [Google Scholar]
- 29.Carabe A, Moteabbed M, Depauw N, et al. Range uncertainty in proton therapy due to variable biological effectiveness. Phys Med Biol. 2012;57:1159–72. doi: 10.1088/0031-9155/57/5/1159. [DOI] [PubMed] [Google Scholar]
- 30.Okamoto H, Kanai T, Kase Y, et al. Relation between lineal energy distribution and relative biological effectiveness for photon beams according to the microdosimetric kinetic model. J Radiat Res. 2011;52:75–81. doi: 10.1269/jrr.10073. [DOI] [PubMed] [Google Scholar]


