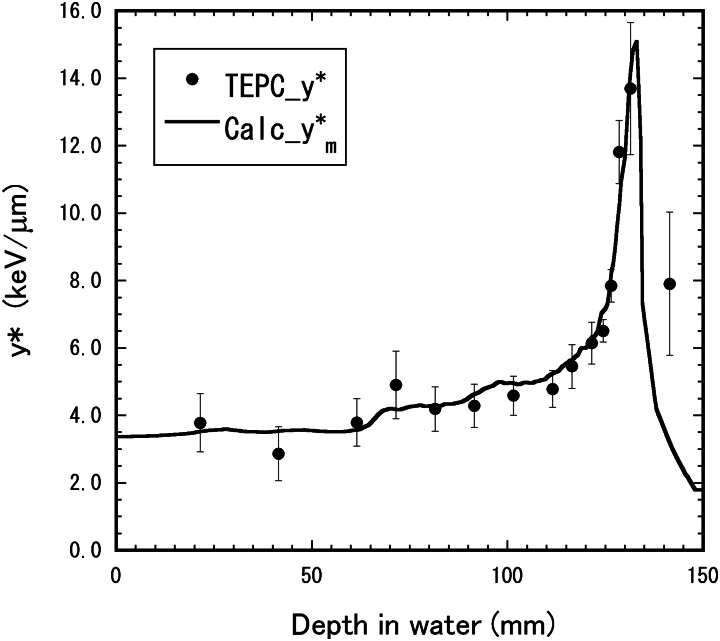
Fig. 6.
Depth–y* distribution for the 155-MeV proton beam with the 6-cm nominal SOBP width. The closed circles represent the y* values directly measured in the SOBP beam. The solid lines show the distribution calculated by the mixing calculation with Eqn (6) from the depth–dose and depth–y* distributions measured in the mono-energetic beam.

