
Fig. 5.
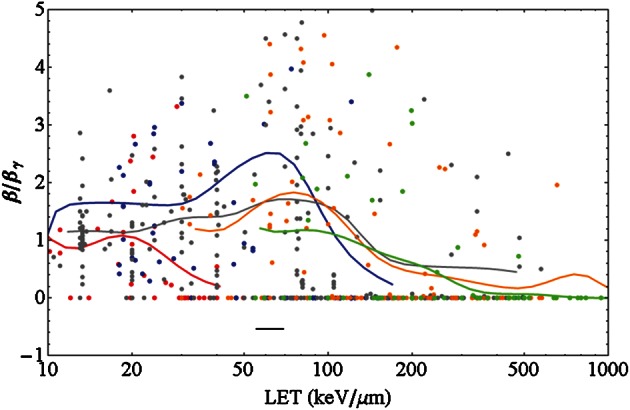
Ratio of the linear-quadratic parameter β of ions to that of photons vs. LET for monoenergetic ions for different ion species with color coding as in Fig. 4. The solid lines are running averages generated by a convolution of the data points with a Gaussian function of width of 0.1 in the decadic logarithmic scale of LET values in keV/µm (i.e. a tenth of the interval between 10 and 100 keV/µm, see the black horizontal bar for an indication of that width). Lighter particles show a vanishing β at lower LET.