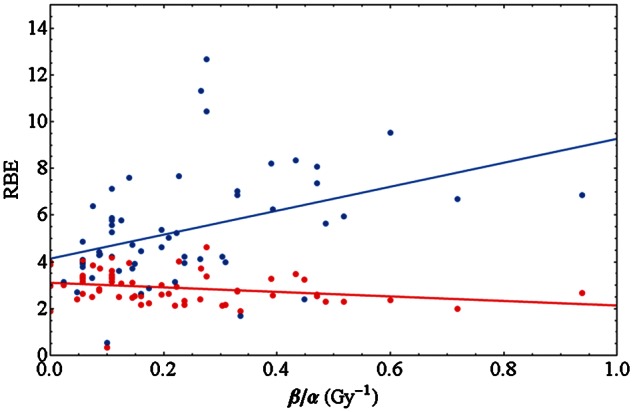
Fig. 6.

RBEα derived from the initial slope of survival curves (blue) and RBE10 for 10% survival (red) for experiments with monoenergetic carbon ions in the LET range 70–130 keV/µm vs the inverse of the photon LQ parameter ratio α/β. While for low doses the RBE increases with β/α, a decrease is observed for high doses. The data shown are restricted to α/β = 1–30 Gy. The solid lines are linear fits to the data points.
