
Fig. 8.
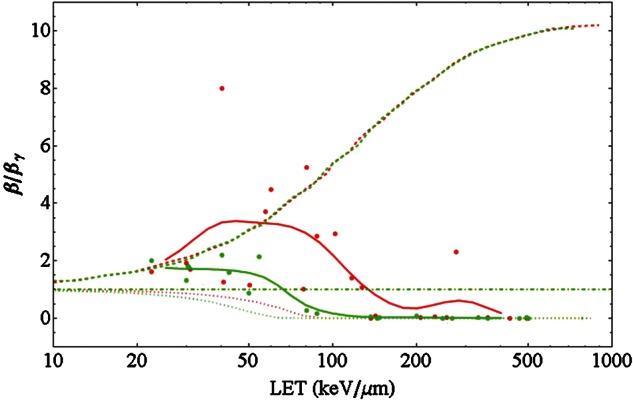
Ratio of the LQ parameter β of carbon ions to that of photons vs. LET for two individual cell lines, V79 cells (red) and HSG cells (green), as measured by Furusawa et al. [30]. As in Fig. 5 the thick lines are obtained as a running average of the data points. The dashed, dotted and dashed–dotted lines show model predictions of the RMF (reproduced from [107] model, the LEM and the MKM, respectively. The photon parameters used for the LEM calculations are α = 0.184 Gy−1, β = 0.02 Gy−2 and the threshold dose [10, 105] Dt = 17 Gy for V79 cells and α = 0.313 Gy−1, β = 0.0615 Gy−2 and Dt = 7.5 Gy for HSG cells.