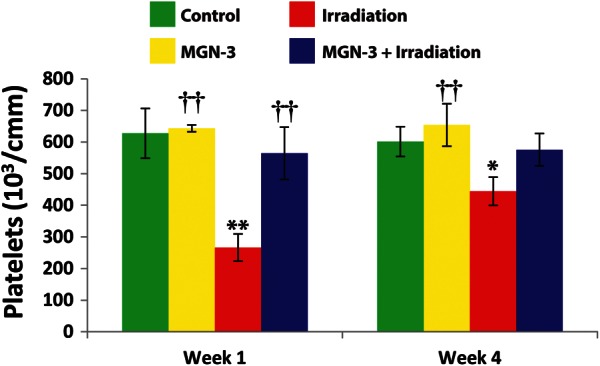
Fig. 3.

Platelet content in mice under different treatments at 1 and 4 weeks post-irradiation. Number of mice per group is 6–9. One asterisk indicates significant difference from the corresponding control group at the 0.05 level. Two asterisks indicate significant difference from the corresponding control group at the 0.01 level. Two daggers indicate significant difference from the irradiation group at the 0.01 level (% difference from the control group).
