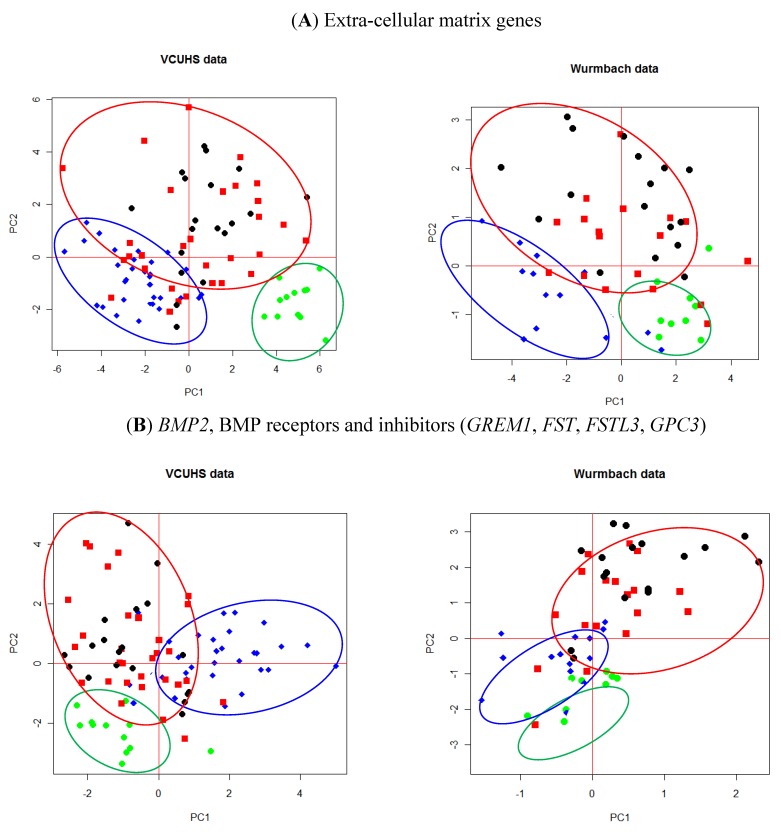
Figure 2.
PCA plots of (A) ECM genes and (B) BMP2 and its receptors and inhibitors. Green = normal control livers; Blue = cirrhosis; Red = early stage HCC; Black = late stage HCC. Normal tissues cluster well away from either cirrhosis or tumors. Both the ECM genes (A) and BMP inhibitors (B) were able to discriminate between cirrhosis and many of the tumor tissues.

