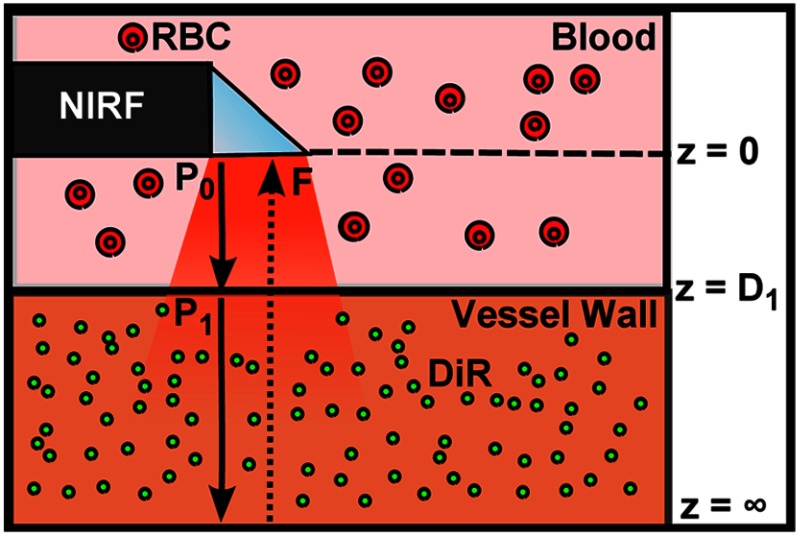
Fig. 2.
One-dimensional (1-D) model of light propagation. Subscripts denote excitation power, , at the beginning of each layer and cumulative fluorescence intensity, , sensed by the optical fiber. Attenuation through blood is governed by Eq. (1) and fluorescence emission from the vessel wall is estimated by Eq. (2).

