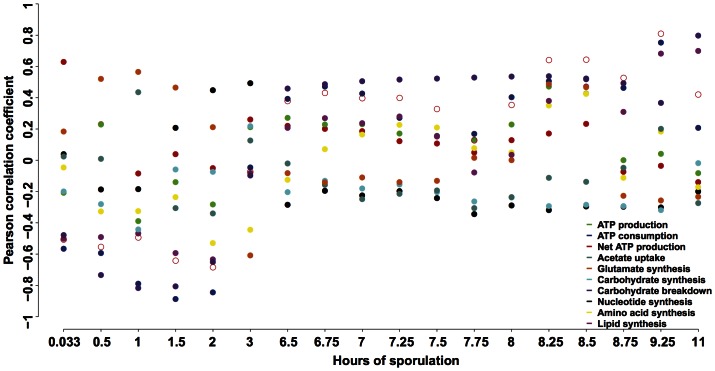
Figure 3. Evaluation of objective functions using the meiosis-specific network models.
The Pearson correlation is calculated between predicted fluxes and biochemical data on eight pathways when maximizing or minimizing each of the ten objective functions at each of the 18 time points. The best objective function for each time point is the one with the maximum Pearson correlation coefficient. Close circle: maximization of an objective function; open circle: minimization of an objective function. Undefined correlation coefficients due to zero variance of predicted pathway fluxes are not shown in the figure.

