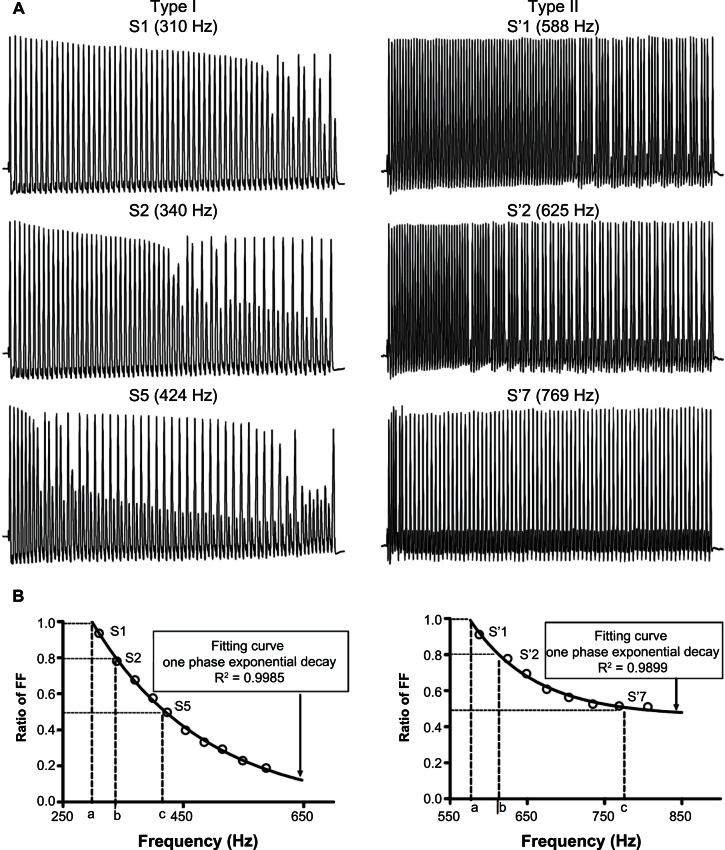
Figure 2.
Patterns of response and measurements from recordings during train pulse stimulation of the dorsal root. (A) Actual recordings from a glabrous rapidly adapting neuron (left panel) and a muscle spindle neuron (right panel) stimulated with a 200-millisecond pulse train in order to demonstrate fractionating and the all-or-none types of response. Three selected recordings in each neuron (top, middle, and bottom in the panel) were sweeps with the Action Potential Following Index close to 1, 0.8, and 0.5, respectively. (B) The curves of frequency following from the recordings in the respective neurons stimulated with trains of different frequencies. It also shows that the maximum (a), 80% (b), and 50% (c) fiber FFs determined from the curve.
Notes: The curve of FF was plotted for a range of frequencies, which was later fitted with a one-phase exponential decay function. R2 values shown represent the degree of fit.
Abbreviations: FF, following frequency; S, somatic.

