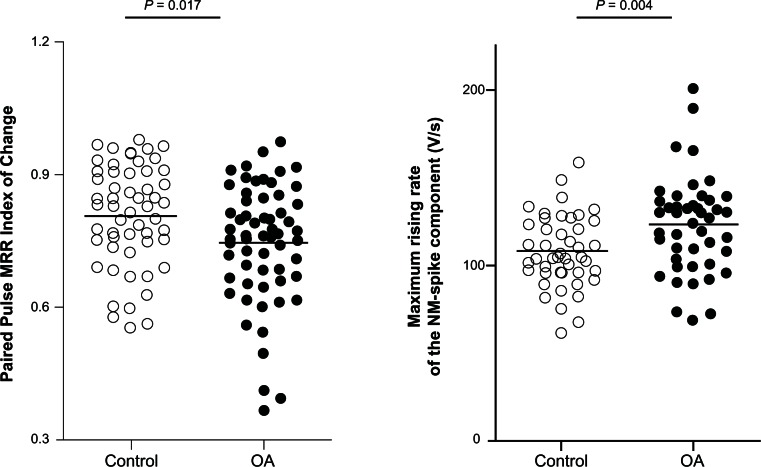
Figure 4.
Changes in the MRR of the evoked action potentials during paired pulse stimulation in Aα/β low threshold mechanoreceptors in OA versus control animals.
Notes: in each case the median (horizontal line) is superimposed. MRR of the somatic-spike component (left panel) and of the NM-spike component (right panel) of the second evoked action potential during the paired pulse stimulation was compared between Aα/β low threshold mechanoreceptors in control versus OA animals. Left panel: the Paired Pulse MRR Index of Change was greater in OA than in control animals (N = 54 in control versus N = 60 in OA animals, Mann-Whitney U test). Right panel: the MRR of the NM-spike was greater in OA animals compared with control animals (N = 44 in control versus N = 46 in OA animals, Student’s t-test). Each dot represents a recording from one neuron.
Abbreviations: MRR, maximum rising rate; NM, nonmyelinated; OA, osteoarthritis.

