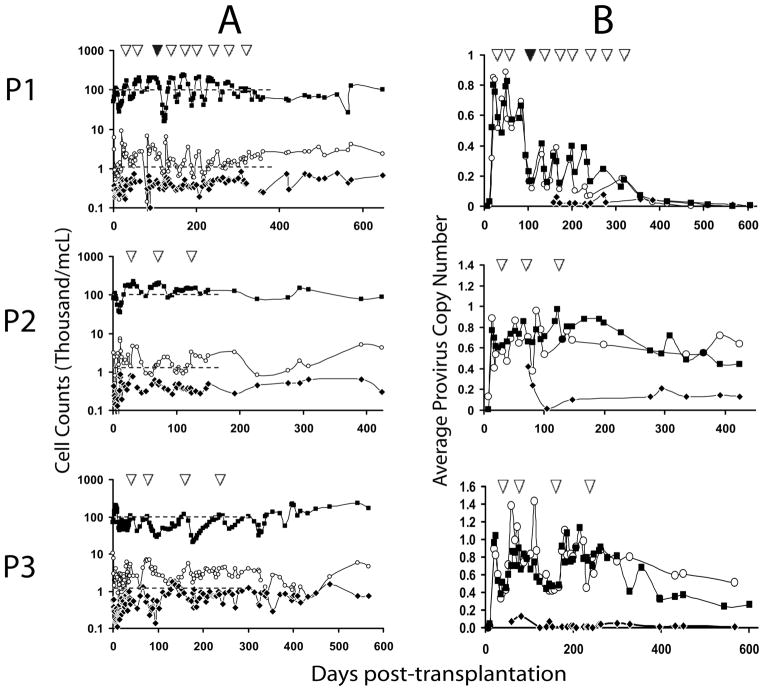
Figure 1. Engraftment and persistence of P140K gene-modified cells.
(A) ANC, lymphocyte and PLT counts in PB as a function of time and chemotherapy. Cell counts on y-axis in thousand per cubic millimeter (mm3) at various time points post-transplantation of gene-modified cells (x-axis). Closed squares (■) represent PLTs, open circles (○) represent ANCs and closed diamonds (◆) represent lymphocytes. Dashed lines (--) represent retreatment threshold of PLTs (upper dashed line) and ANC (lower dashed line). (B) Gene marking in circulating WBC subsets. Graphs represent average proviral copy number per genome as determined by real-time PCR (y-axis), at various time points post-transplantation (x-axis) in bulk WBCs (closed squares; ■) CD13+ or CD15+ granulocytes (open circles; ○) and CD3+ lymphocytes (closed diamonds;◆). In both panels, inverted open triangles (△) indicate cycles of O6BG/TMZ chemotherapy. Closed triangle (▲) in P1 graph represents single dose-escalated cycle of TMZ (590 mg/m2).

