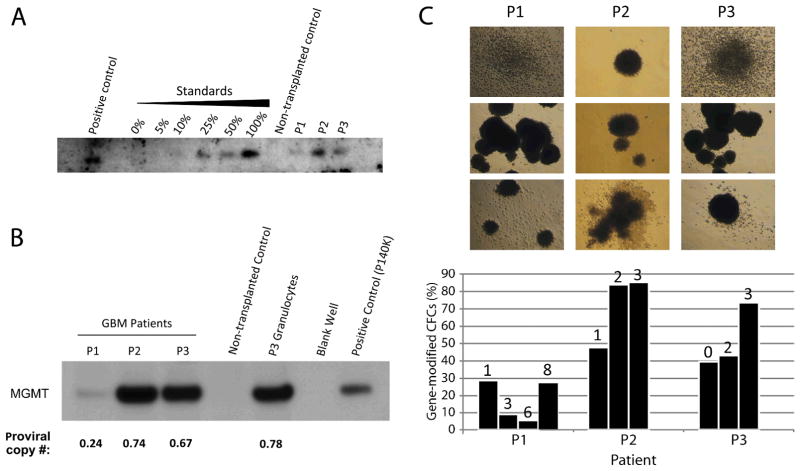
Figure 2. Detection of P140K gene sequence and MGMT protein expression in patient hematopoietic cells following transplantation.
(A) Southern blot analysis for P140K gene sequence in DNA. Positive control is DNA isolated from P140K-GFP expressing primate WBCs. Standards represent DNA isolated from WBCs of the same primate, sorted for GFP by flow cytometry and mixed with GFP−WBC DNA. Negative control is WBC DNA collected from a non-transplanted human donor. Patient samples represent DNA isolated from WBCs at nine months post-transplantation. (B) MGMT expression in total protein lysates from patient WBCs at 4 months post-transplantation as assessed by western blotting. Positive control is purified P140K protein from the vector producing line generated for this study, negative control is total protein from WBCs from a non-transplanted human donor. (C) Colony forming assays from PB CD34+ cells demonstrate repopulating cells harboring gene modification. Photographs illustrate representative colonies derived from PB CD34+ cells from P1, P2 and P3. Bar graph shows percentage of colonies positive for MND provirus at multiple time points for each patient. Numbers above each bar represent the number of O6BG/TMZ chemotherapy cycles received prior to colony forming assay time point. Each bar value is based on a minimum of 20 colonies assessed by PCR.

