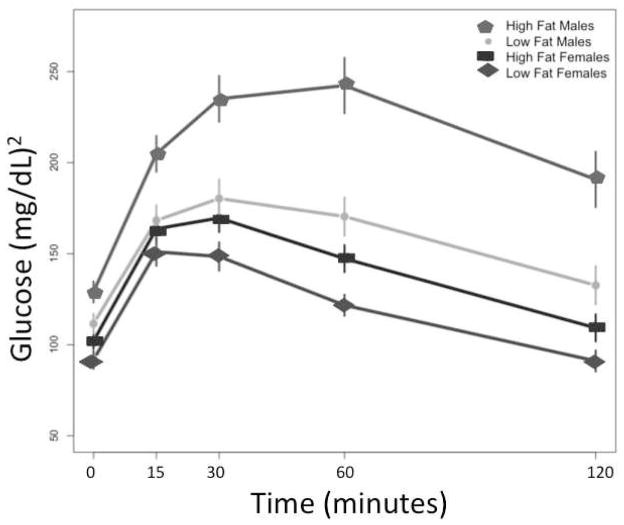
FIGURE 1.
Phenotypic variation in response to glucose stress, as measured by an intra-peritoneal injection of 0.01ml of 10% glucose solution per gram of body weight (IPGTT). Measurements taken over the course of 2 hours were used to calculate the area under the curve (AUC), an overall measure of glucose tolerance, among each sex-by-diet cohort. High-fat fed male glucose levels continue to elevate for a longer time period, and then decline at a slower rate, than any other sex-by-diet cohort in this population.

