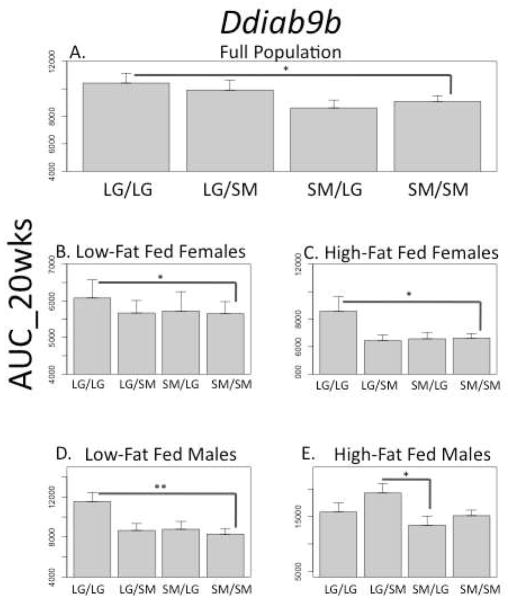
FIGURE 3.
QTL Ddiab9b associated with glucose tolerance at 20 weeks as measured by the IPGTT. There are significant positive additive effects in the full population, as well as in all cohorts (A–D) except the high-fat fed males. In males fed a high-fat diet, there is a significant bipolar dominance imprinting effect (E). The different scales among the cohorts reflect their different mean phenotypic scores for this trait. *p ≤ 0.05; **p ≤ 0.01

