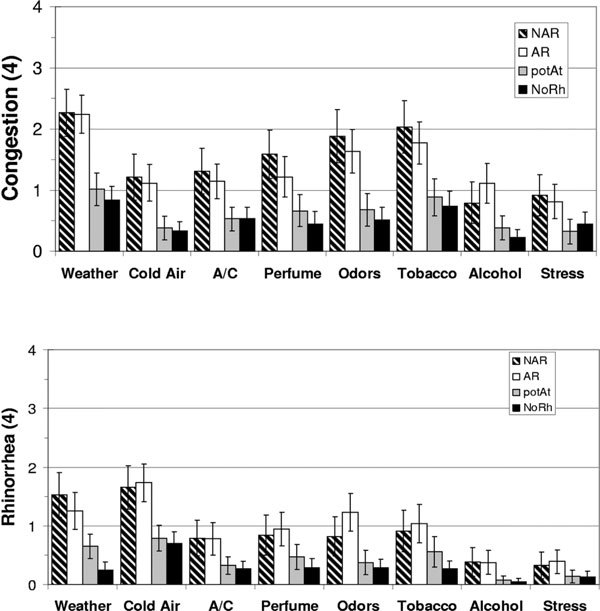
Figure 3.

Sensations of congestion (A) and rhinorrhea (B) induced by 8 triggers in NAR (bars with diagonal lines), AR (white bars), potAt (positive allergy skin tests with minimal symptoms; gray bars), and NoRh (black bars). Mean ± 95% CI. CI indicates confidence interval; NAR, nonallergic rhinitis; NoRh, no rhinitis; potAt, potential atopy.
