
Figure 4. Comparison of VTCAn versus glutamate and NAA concentrations in the midline occipital parietal lobe of healthy elderly subjects.
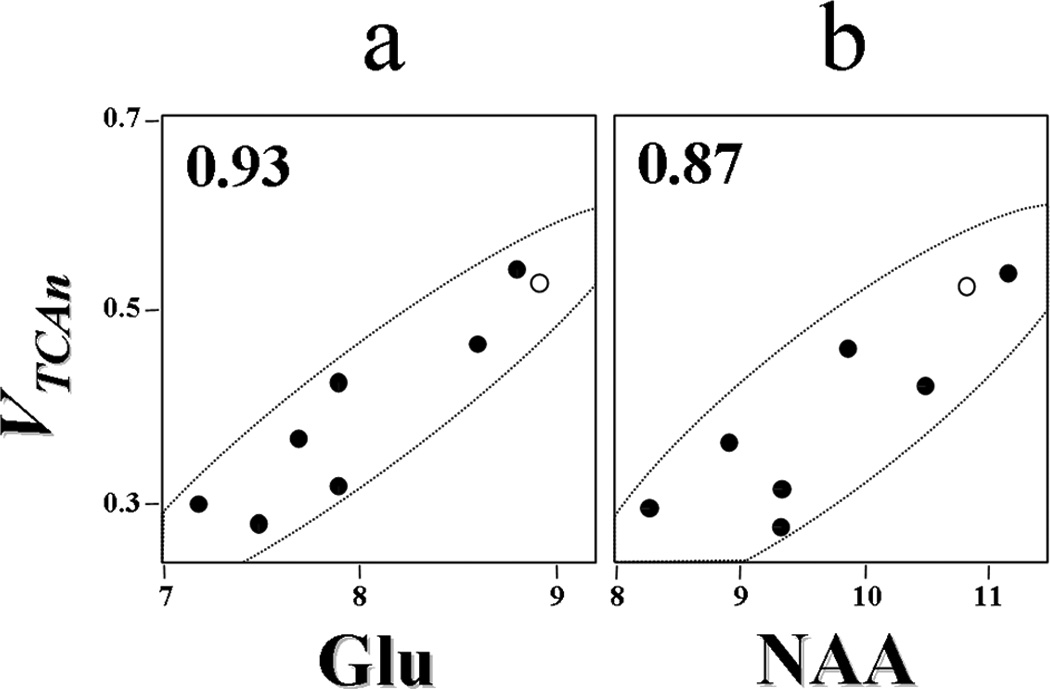
The results show a strong correlation between the rate of the neuronal TCA cycle and the concentrations of glutamate (Glu) and NAA, both of which have been associated with cellular dysfunction and chronically reduced mitochondrial activity in other studies. Pearson correlation coefficients appear in upper left corners of a and b Closed circles, values measured for the individual elderly subjects (n=7). Open circles, average values for the respective metabolite concentrations from a young cohort (n=7). Fluxes and metabolite concentrations are expressed as µmol.g−1.min−1 and µmol.g−1 respectively.