
Figure 6. 13C MRS time course spectra of glutamate, glutamine, and aspartate turnover detected in the occipital lobe during intravenous infusion of [2-13C] glucose.
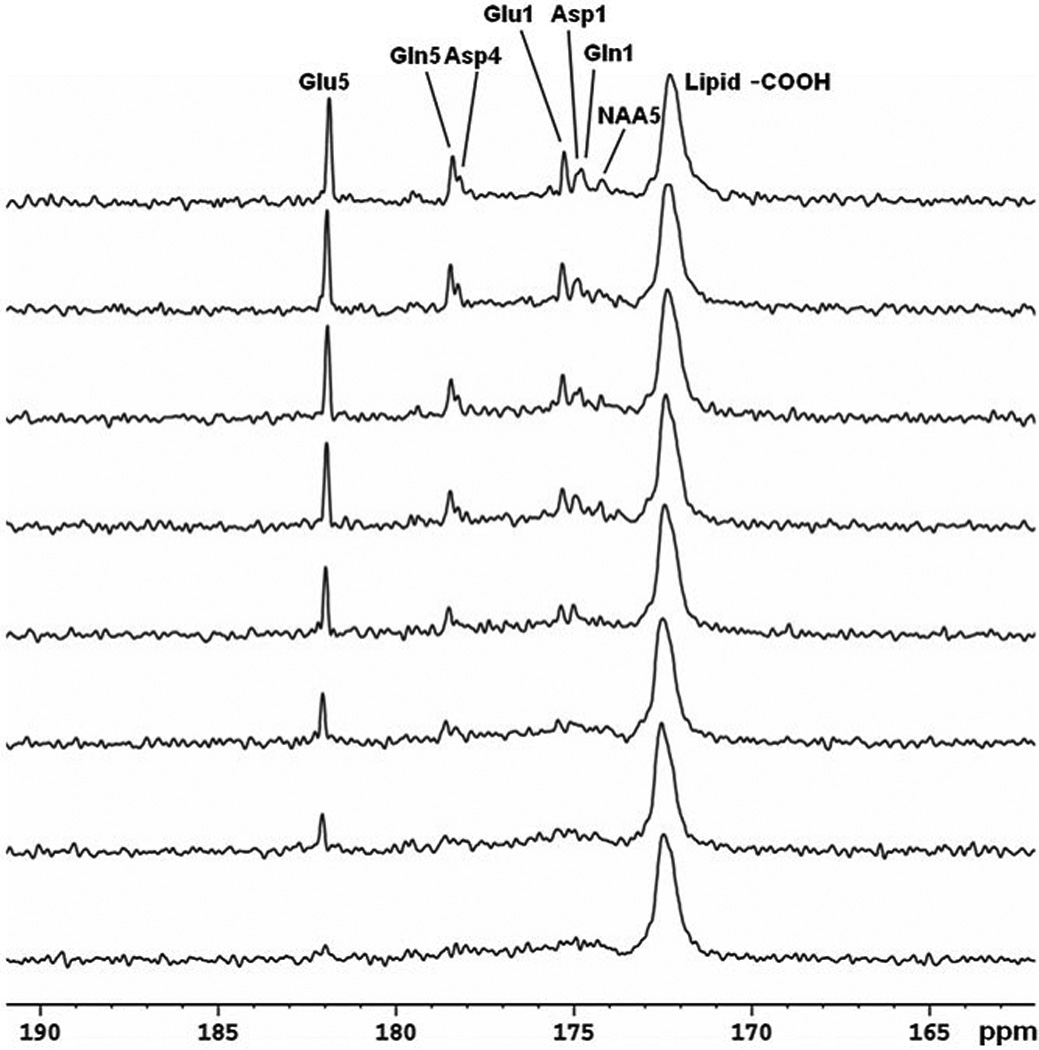
Lorentz–Gauss transformation (LB = 3 Hz, GB = −0.3) was applied. The time-averaged decoupling power was 1.46 W. Each spectrum corresponds to 8.5-min of signal averaging (128 scans). Glu C5 (182.0 ppm) and C1 (175.4 ppm), Gln C5 (178.5 ppm) and C1 (174.9 ppm), Asp C4 (178.3 ppm) and C1 (175.0 ppm), as well as NAA C5 (174.3 ppm) were detected. No baseline corrections were made. Glu, glutamate; Gln, glutamine; Asp, aspartate; NAA, N-acetylaspartate. Figure adapted from Li et al. (141).