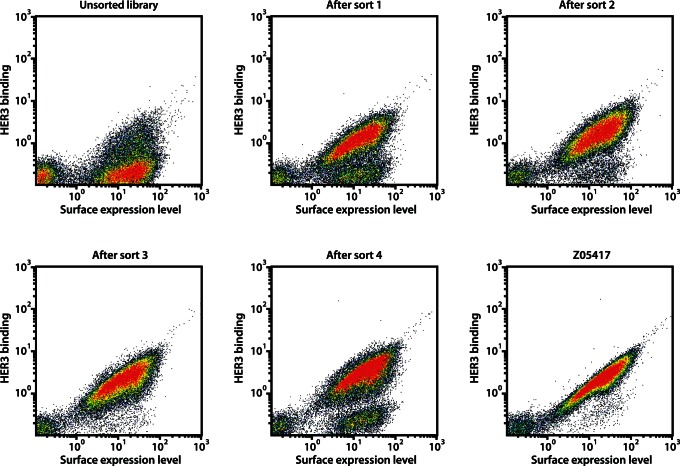
Figure 2. Fluorescence-activated cell sorting of Sc:ZHER3LIB2.
Density dot plots of the affinity maturation library displayed on S. carnosus, showing the HER3-binding signal on the y-axis and the surface expression level on the x-axis. The dot plots show cells from the unsorted library as well as cells isolated from the first, second, third and fourth sorting round, respectively. For comparison of HER3-binding signals, a dot plot showing Z05417 is included.

