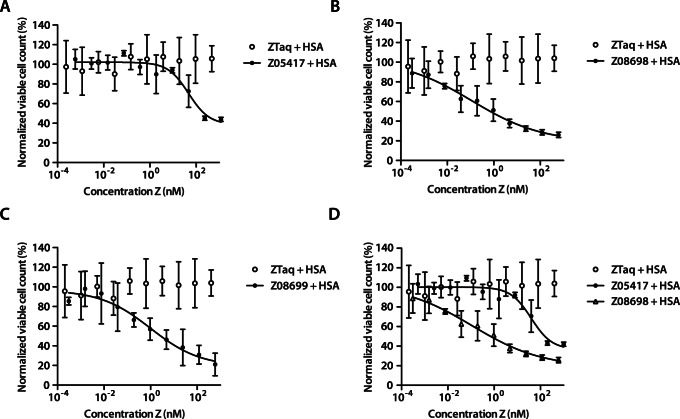
Figure 5. Inhibition of heregulin-induced cell proliferation.
MCF-7 cells were treated with heregulin, HSA and a titration series of respective Affibody molecule. Plots showing the normalized viable cell concentration (measured using a CCK-8 kit) on the y-axis and the Affibody concentration on the x-axis. A. Z05417 and negative control ZTaq. B. Z08698 and negative control ZTaq. C. Z08699 and negative control ZTaq. D. Comparison of Z05417 and Z08698. The signals corresponding to the viable cell concentrations were normalized with the average of the signals from samples treated with the negative control Affibody molecule (ZTaq). The experiment was performed in duplicate on different days using freshly prepared solutions and each sample was analyzed at least in triplicate in each experiment. Data is represented as means with indicated standard deviations.

