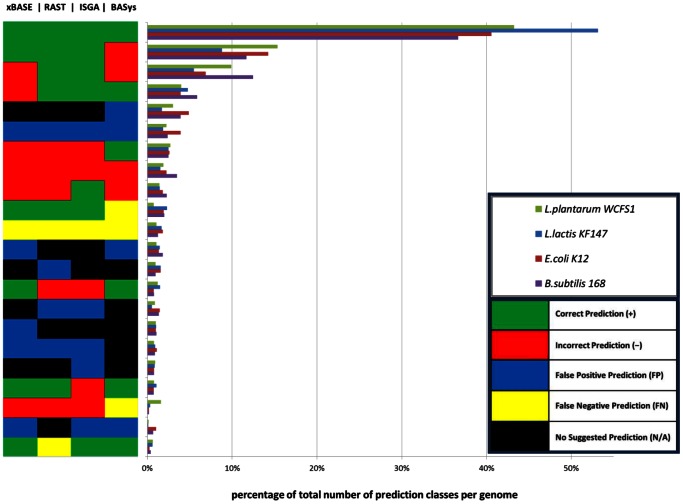
Figure 4. Variation in AGE predictions for four moderate GC% bacterial genomes.
The start codon prediction accuracy by BASys, ISGA, RAST and xBASE is illustrated in this vertical bar-graph for four bacterial reference genomes: B. subtilis 168, E. coli K12 MG1655, L. lactis KF147 and L. plantarum WCFS1. On the y-axis, the different classes of predicted ORF starts compared to the respective reference genomes are shown. A black colored box is present only in combination with false positive predictions (blue). It signifies that for these mORFs no prediction data was provided by any of the other AGEs. A total of 82 unique color/prediction classes were defined. They were plotted on the y-axis and a number was assigned according to its prevalence per bacterial genome. These numbers are shown as a bar-graph on the x-axis: as a fraction/percentage of the total number of mORFs available for that genome. In order to reduce the number of classes, those that occurred on average less than 0.50% in the four genomes were removed leaving 22 prediction classes. See for all 82 classes Figure S2.

