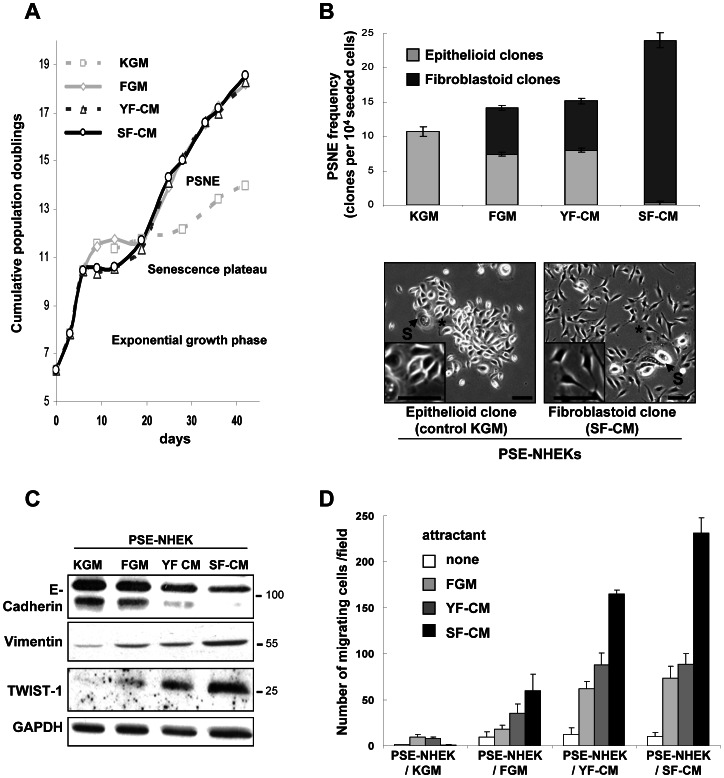
Figure 1. Impact of senescent-fibroblast-conditioned medium on keratinocyte growth, senescence, post-senescence emergence and the epithelial-mesenchymal transition.
A. Growth curves of NHEKs (donor 2F1958) cultured for 45 days in either control keratinocyte medium (KGM), 90% KGM+10% fresh fibroblast growth medium (FGM), 90% KGM+10% young fibroblast-conditioned medium (YF-CM), or 90% KGM+10% senescent fibroblast-conditioned medium (SF-CM). (PSNE = Post Senescence Neoplastic Emergence). The graph is representative of eight independent experiments. B. Senescent NHEKs cultured under the four above-described conditions were plated at low density (10,000 cells per 100 mm dish). After a week, the total number of epithelioid (gray) and fibroblastoid (black) post-senescence clones was counted in each culture dish (n = 6). The PSNE frequency was calculated as described under Materials and Methods. The graph shows the mean PSNE frequency±SD. Results of statistical analyses are given in Figure S2A. Results are representative of two independent experiments performed with cells from donor 2F1958. Representative images of epithelioid PSE-NHEKs clones from control culture conditions, and fibroblastoid PSE-NHEKs clones from co-culture with SF-CM are shown. Senescent cells (S) amongst PSE cells are indicated. Inserts show magnification of areas marked by an asterisk. Bar = 100 µm. Two duplicated independent experiments with NHEKs and conditioned media from autologous NHDFs from two other donors showed a similar promotion of fibroblastoid PSE-NHEK emergence. C. Western blot analyses showing levels of molecular EMT markers (E-cadherin, vimentin, and TWIST-1) in PSE-NHEKs obtained under the four above-mentioned culture conditions. Quantitative analysis is provided in Figure S2C. Results are representative of two complete cultures and of independent western blotting experiments performed with material from donor 2F1958. D. Migration assays. PSE-NHEKs cultured as described above were starved in fresh KBM for 16 h, trypsinized, and seeded in KBM into Transwell® plates. FGM, YF-CM, or SF-CM was placed in the lower chamber as attractant. After 30 h of incubation at 37°C, cells having migrated were counted (ten random fields per well were counted, and each condition was in triplicate). Results are given as mean ± SD. Similar results were obtained in three independent experiments with cells from donor 2F1958. Statistical analyses are detailed in Figure S2D.

