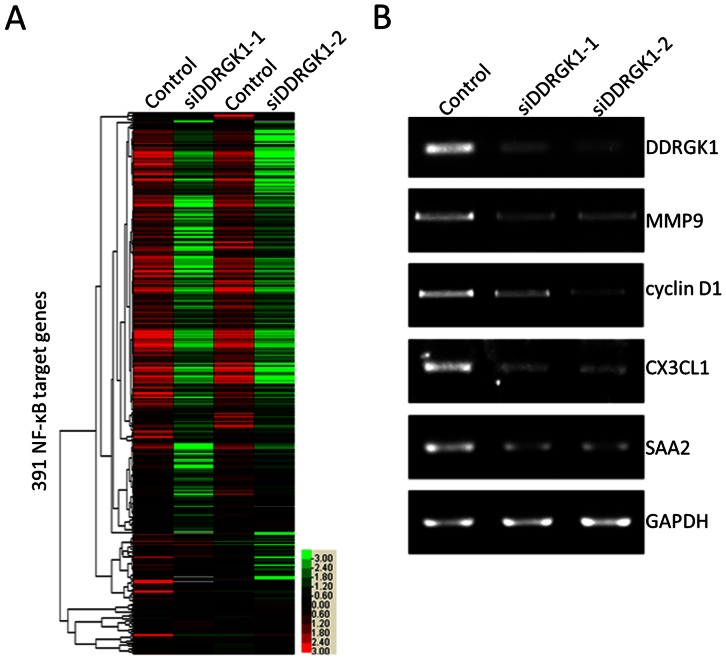
Figure 4. The depletion of DDRGK1 inhibits the expression of NF-κB target genes in U2OS cells.
(A) The expression levels of NF-κB target genes were analyzed by microarray. U2OS cells were transfected with DDRGK1 siRNA1 and siRNA2, respectively. The mRNAs were isolated for microarray analysis. The ratio of the abundance of transcripts of each gene in a given sample to its median abundance is represented by the color of the corresponding cell in the Tree View-generated diagram. Green cells represent the genes with transcript levels below their median abundances, black cells represent genes with transcript levels equal to their median abundances, and red cells represent genes with transcript levels that are greater than their median abundances. Gray cells indicate technically inadequate or missing data. The color saturation of each cell reflects the magnitude of the ratio relative to the mean for each gene. NF-κB target genes were selected based on information from the Boston University network (http://www.bu.edu/nf-kb/gene-resources/target-genes/). (B) RT-PCR analysis of selected NF-κB target genes was performed to validate the results of the microarray. U2OS cells were transfected with DDRGK1 siRNA1 or siRNA2, and total RNAs were extracted. The expression of DDRGK1 and four selected NF-κB target genes (MMP9, cyclin D1, CX3CL1 and SAA2) were analyzed by RT-PCR with the specific primers listed in the Experimental Procedures. GAPDH was used as a loading control.

