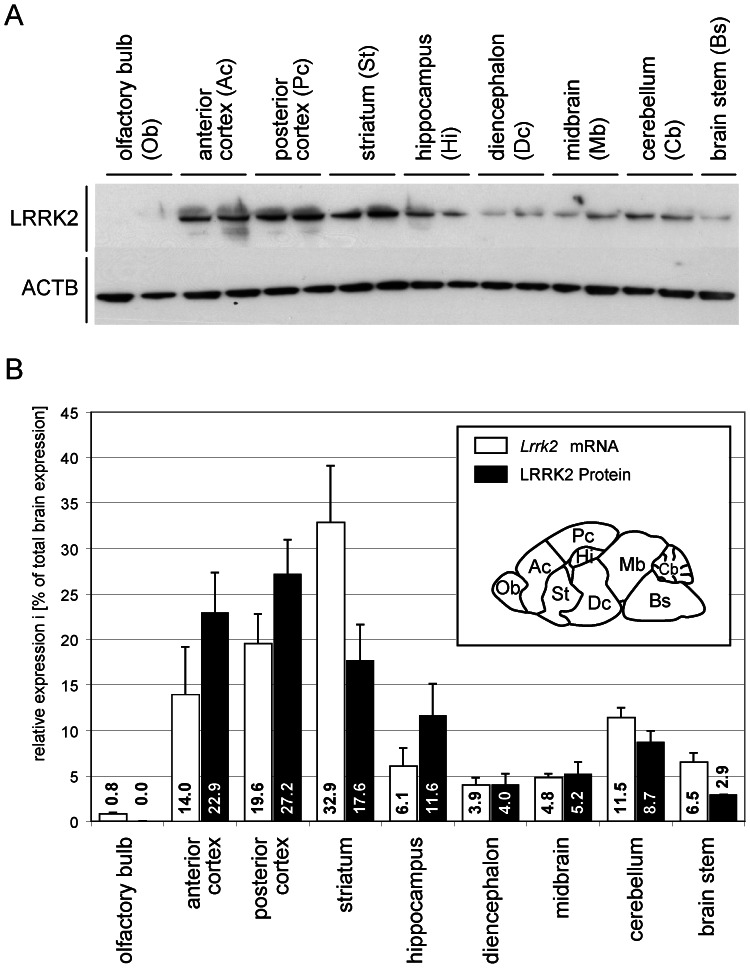
Figure 4. Expression analysis of Lrrk2 mRNA and protein in various brain regions from adult mice.
Quantifications of Lrrk2 level in various brain regions by qPCR (mRNA) and Western blot (protein). Before calculation, LRRK2 protein level from Western blot analyses (A, representative Western blot) were normalized to beta-actin (ACTB) as loading control and Lrrk2 mRNA level from qPCR to a beta-actin control accordingly. (B) To allow a direct comparison between Lrrk2 mRNA and protein level, the sum of all individual relative expression level were set to 100% in both cases ({percentage brain region}z. = {relative level brain region}/{sum of all relative level}×100%). The definition of brain regions used for this analysis is indicated in the figure legend (B). Abbreviations: Ac, anterior cortex; Bs, brain stem; Cb, cerebellum; Dc, diencephalon; Hi, hippocampus; Mb, midbrain; Ob, olfactory bulb; Pc, posterior cortex; St, striatum.

