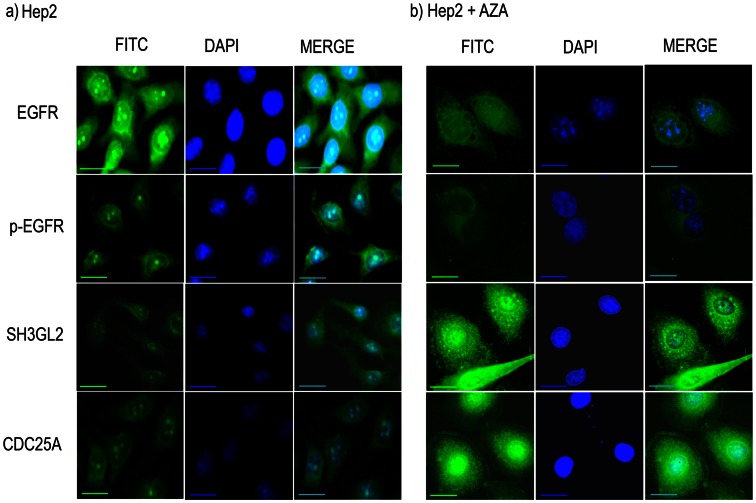
Figure 6. Immunocytochemical analysis of EGFR, SH3GL2, CDC25A and p-EGFR.
over night subconfluent cover slip culture of Hep2 cell line was treated with 5-aza-dc for 72 hour and protein expression of the genes were analyzed by ICC after fixing the cells. EGFR and p-EGFR showed reduced expression in treated cells (b) compare to non treated cells (a). On the contrary, SH3GL2 and CDC25A showed upregulation of cytoplasmic/nuclear expression after aza treatment (b) compare to untreated cells (a). Scale bars in microphotograph represent 50 µm.

