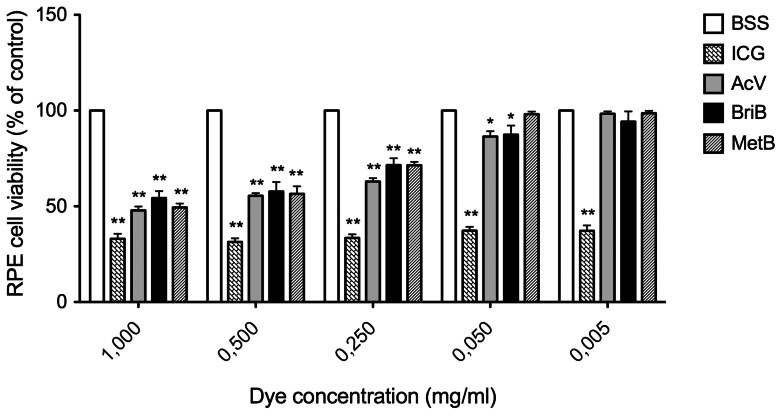
Figure 2. Effect of different doses of indocyanine green (ICG), acid violet (AcV), brilliant blue (BriB) and methyl blue (MetB) on ARPE-19 cells viability determined by MTS cell assay after 30 minutes of exposure to dyes.
Bars correspond to means of three independent experiments. Data are expressed as percentage of control, and the results shown are mean results ± SEM of three independent experiments run in triplicate on cultured cells. Statistical significance is indicated by *P<0.05, **P<0.01 for comparison with the control (BSS solution).

