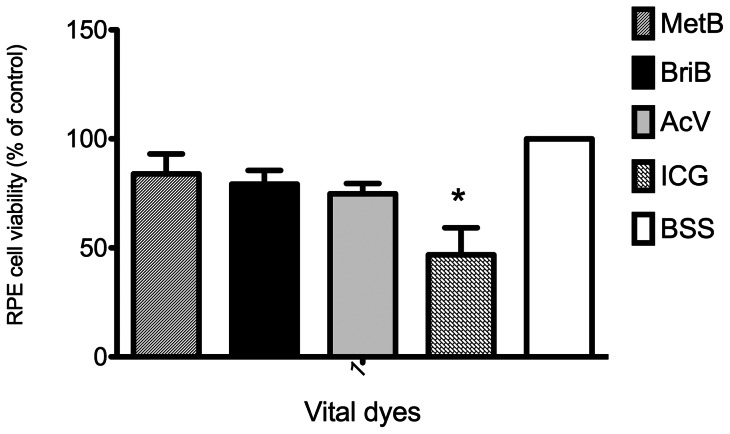
Figure 4. Combined results of effect of vital dyes on ARPE-19 cells viability.
The effects of dyes on cell viability were combined for all concentrations and both exposure times and the dyes compared. Bars correspond to means of three independent experiments. Data are expressed as percentage of control, and the results shown are mean results ± SEM of three independent experiments run in triplicate on cultured cells. Statistical significance is indicated by *P<0.01 for comparison with the control (BSS solution).

