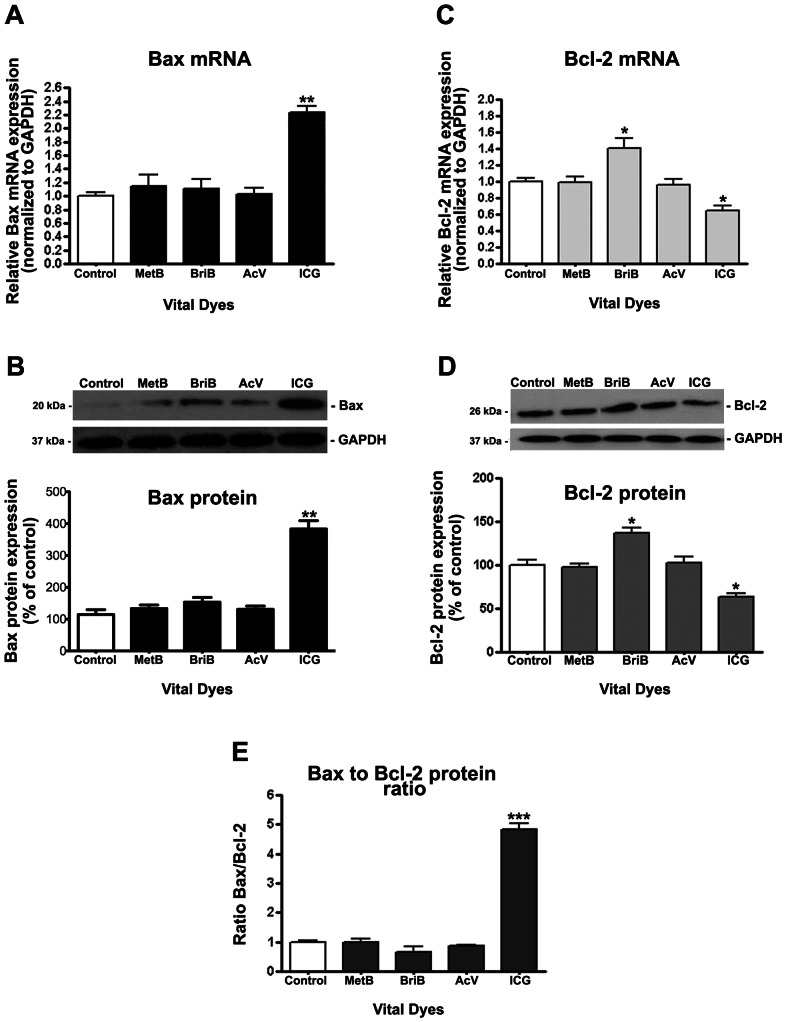
Figure 6. Bax/Bcl-2 ratio in ARPE-19 cells following treatment with vital dyes.
Confluent ARPE-19 cells were treated with 0.05 mg/ml indocyanine green (ICG), acid violet (AcV), brilliant blue (BriB) and methyl blue (MetB) for 3 minutes in BSS. Total RNA and proteins were extracted to assess Bax (A) and Bcl-2 (C) mRNA expression and Bax (B) and Bcl-2 (D) protein expression by real-time PCR and Western blot respectively. GAPDH was used as the internal control. Representative Western blot gel (Top) of proapoptotic protein Bax (B) and antiapoptotic protein Bcl-2 (D). The numbers to the left are molecular weights in kilodaltons (kDa). Bottom: average densitometry results from three independent experiments. (E) Bax/Bcl-2 protein ratio. Data are mean ± SE and represent the average results of 3 independent experiments run in duplicate. * is p<0.05, ** is p<0.01 and *** is p<0.001 versus control.

