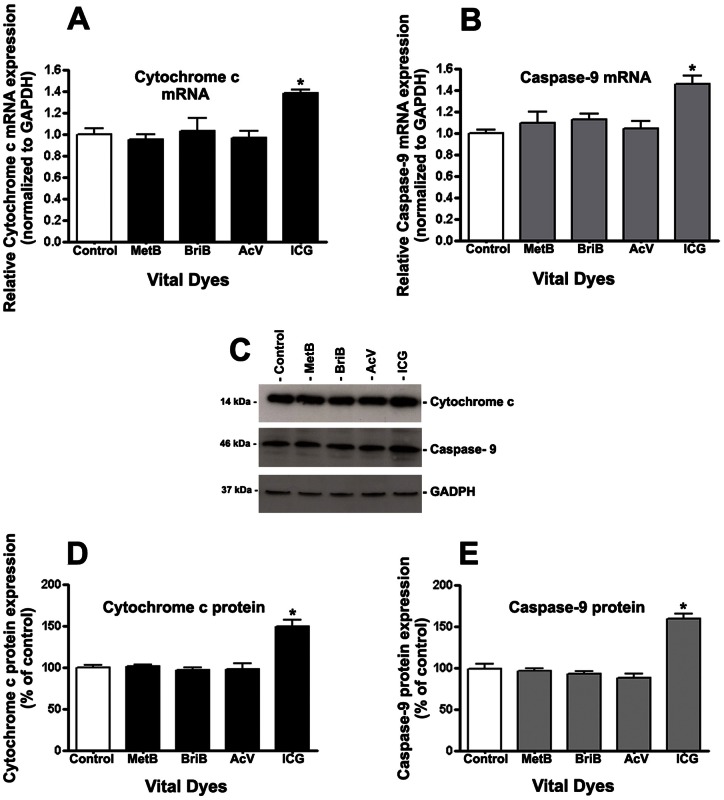
Figure 7. Cytochrome c and Caspase-9 were upregulated by ICG in ARPE-19 cells.
Cytochrome c (A and D) and caspase-9 (B and C) mRNA and protein expression in response to 0.05 mg/ml BriB, MetB, AcV, and ICG treatment for 3 minutes. Total RNA and proteins were extracted to assess cytochrome c (A) and caspase-9 (C) mRNA expression and Cytochrome c (B) and Caspase-9 (D) protein expression by real-time PCR and Western blot respectively. GAPDH was used as the internal control. Representative Western blot gels (C). The numbers to the left are molecular weights in kilodaltons (kDa). Average densitometry results of three independent experiments (D, E). Data are mean ± SE and represent the average results of 3 independent experiments run in duplicate. * is p<0.05 versus control.

