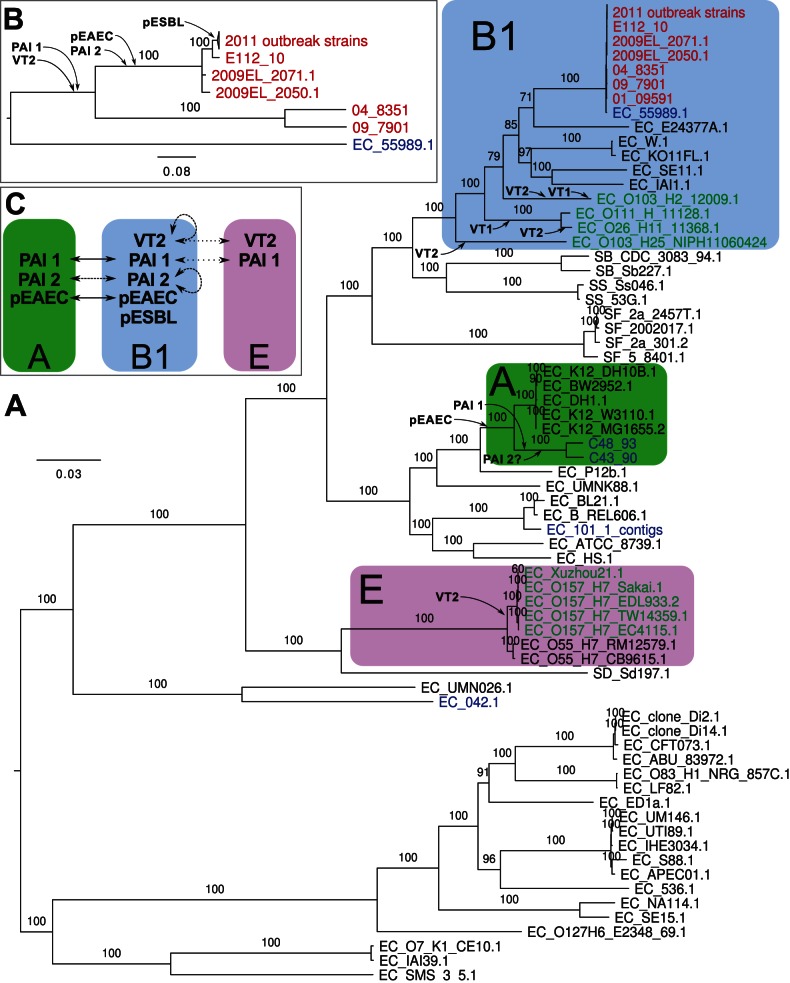
Figure 1. Phylogeny of E.coli and Salmonella genomes.
Maximum-likelihood phylogenies (A) of all E. coli and Salmonella strains for which genome data is available and (B) of selected O104:H4 strains and their closest non-O104:H4 strain, 55989. Font coloring, red: O104:H4 strains; blue: EAEC of non-O104:H4 serotype; green: EHEC strains. Phylogroups B1, A and E [7] are shown with blue, green and violet boxes, respectively. The probable insertions of prophages, genomic islands and plasmids are indicated. Bootstrap support higher than 70 (out of 100) is shown. To improve readability of the tree in panel A, bootstraps are not shown in the clade that is also depicted in panel B. (C) Inferred lateral transfers of virulence factors between phylogroups A, B1 and E.

