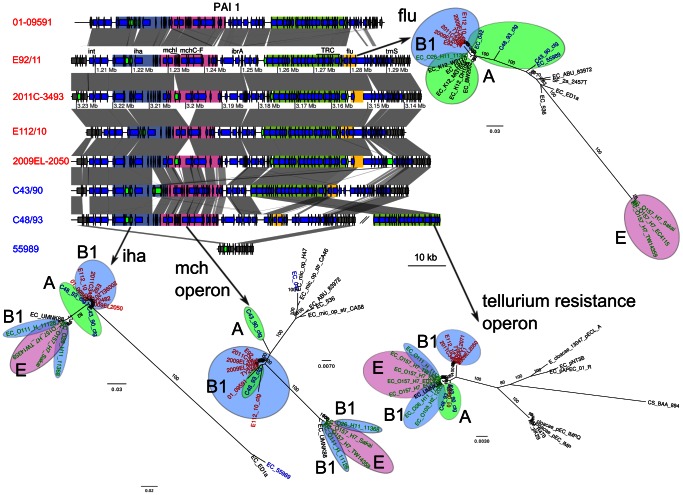
Figure 5. Comparison of the gene order structures of pathogenicity island 1 (PAI1).
Genes located inside PAI1 are shown as blue arrows. Genes shown as green arrows are mobile genes (transposases, transposons and IS sequences). Four regions are defined with colors, and contain the iha gene (blue-grey), the microcin operon (pink), the tellurium resistance cluster (green) and the flu genes (yellow). Comparisons are shown as in Figure 3. The maximum-likelihood phylogenies of these regions are represented next to the gene map. Colors represent different subsets of strains, as in Figure 1.

