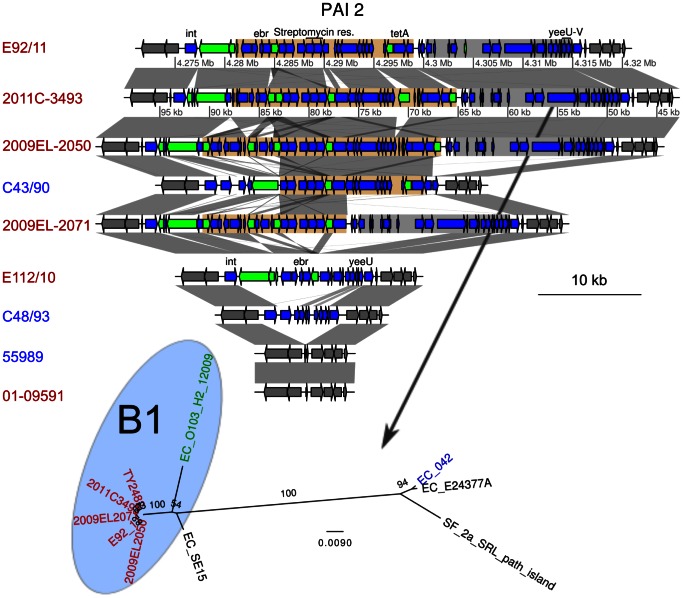
Figure 6. Comparison of the gene order structures of pathogenicity island 2 (PAI2).
Genes located inside PAI2 are shown as blue arrows. Genes shown as green arrows are mobile genes (transposases, transposons and IS sequences). Two regions are defined with colors, and contain an antibiotic resistance cluster (light brown) and the 3′ region of the PAI (grey). The location of the integrase (int), ethidium bromide resistance gene (ebr), the streptomycin resistance genes, the tetramycin resistance gene (tetA) and the toxin-antitoxin genes yeeU-yeeV are shown. Comparisons are shown as in Figure 3. The maximum-likelihood phylogenies of the second regions is represented next to the gene map. The phylogeny of the first region was not inferred, due to too many rearrangements in this region. Colors represent different subsets of strains, as in Figure 1.

