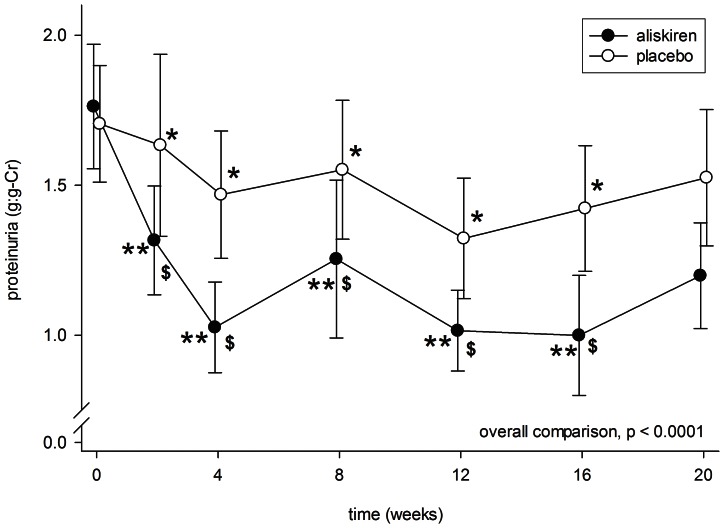
Figure 2. Serial change in proteinuria during the periods of aliskiren (closed circles) and placebo (open circles) treatment.
Error bars denote standard error of mean. Post-hoc comparisons were performed by paired Student’s t test: *p<0.05 and **p<0.0001 as compared to baseline level; $p<0.01 as compared to the period of placebo treatment. All P values were computed with Bonferroni adjustment for multiple comparisons.

