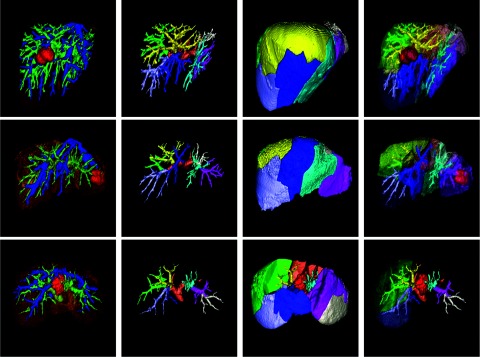
Figure 6.

Liver segment approximation and visualization. (First column) accurate segmentation result. (Second column) different portions of the portal veins. (Third column) different liver segments. (Fourth column) a semitransparent visualization of the liver segments, portal veins, and tumors. Some liver segments are hided in the third row for a better visualization of the intrahepatic tumor.
