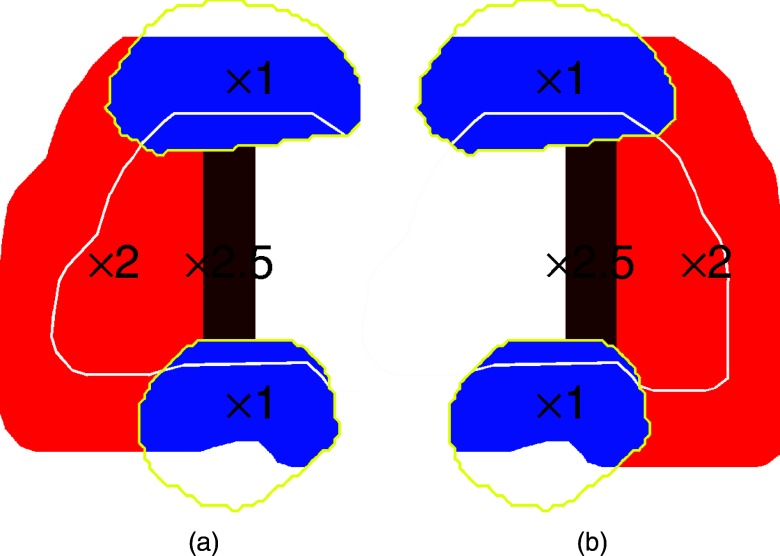
Figure 3.
Schematic illustration of construction of intensity maps for two consecutive fractions delivering IFD, which boosted (a) right and (b) left hemisphere of the prostate. Target contour is shown in white; contours of the bladder and rectum are shown in yellow. Intensities of spots within the rectum or bladder (blue) were not modified. Spots outside of organs at risk were doubled on the proximal side of the target, and suppressed on the distal side. The spots within 10 mm of the plane of splitting were further enhanced by 25%.

