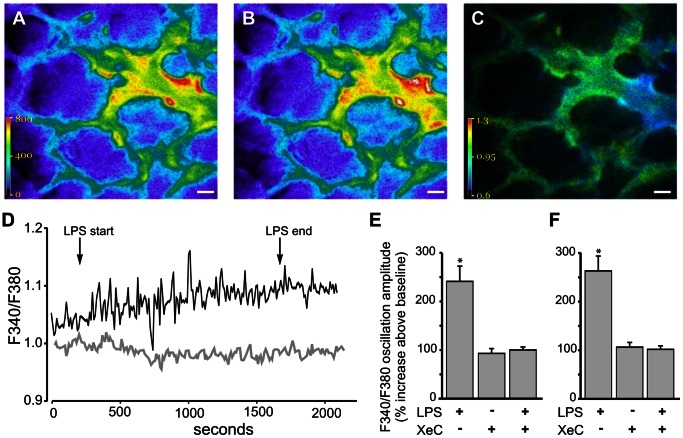
Figure 1. Ca2+ response in lung microvessels.
A–C Pseudocolor images show fluorescence emission in response to exciting Fura2-AM loaded microvessels at 340 nm (A) and 380 nm (B). The corresponding 340/380 fluorescence ratio was quantified on a pixel-by-pixel basis and displayed as a pseudocolored image (C). Scale bar = 20 µm. D. Tracings show temporal changes in F340/F380 in response to LPS infusions (100 µg/ml) into control (black tracing) and XeC-pretreated (gray tracing) lung microvessels. E, F Bar graphs show composite increase in the LPS-induced F340/F380 oscillation amplitude above baseline values for venules (E) and capillaries (F). Mean±SE. n = 4 vessels from 3 lungs per group. *-p<0.05 compared to XeC and XeC+LPS treatment groups.

