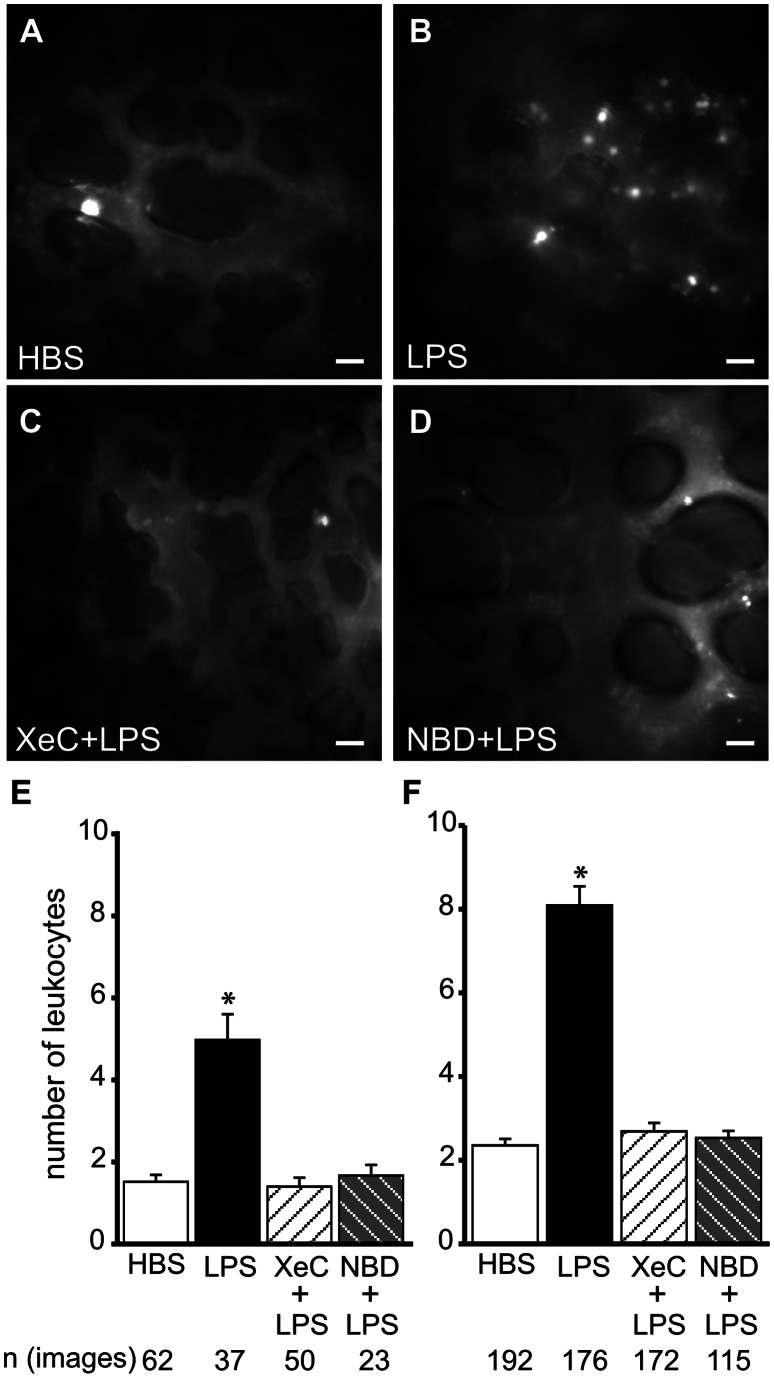
Figure 4. Leukocyte retention in lung microvessels.
A–D Fluorescence images show retention of R6G-labeled leukocytes in lung microvessels following treatments, as indicated. Treatment durations and agent concentrations were as outlined in Methods. Scale bar = 20 µm. E, F Bar graphs show number of retained leukocytes per image frame in venules (E) and capillaries (F) following the indicated treatments. Mean±SE. n - number of images analyzed per group (3 lungs per group). *-p<0.05 compared to HBS, XeC+LPS and NBD+LPS groups. NBD = IKK-NBD.

