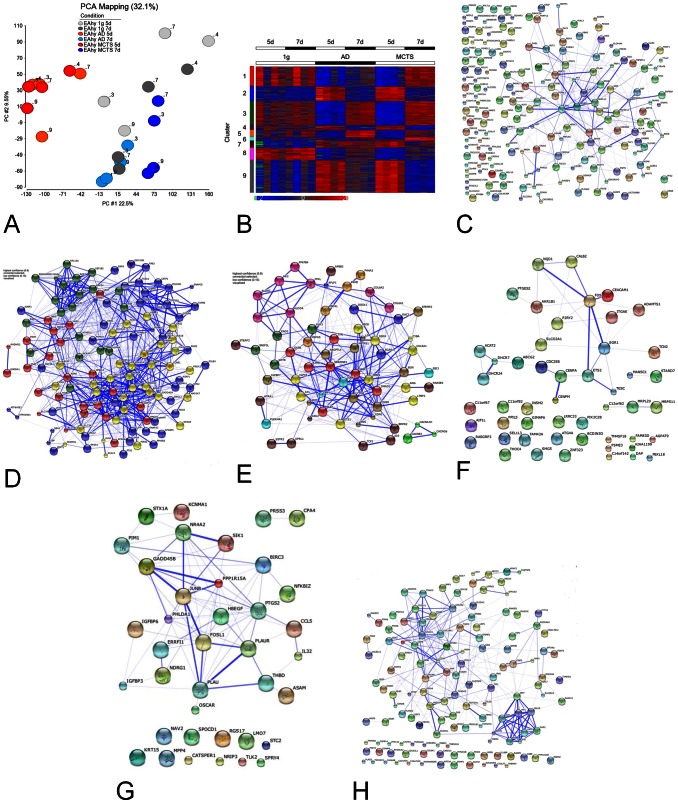
Figure 2. Microarray Analysis.
(A) The first two PCs of the PCA of 31,991 expressed transcripts describe 32.1% of the dataset variance. The five-day RPM samples showed a separation from 1 g controls and seven-day RPM samples in PC #1 (22.5% of the variance). (B) K-mean clustering of the 1625 significantly regulated probes. The color scale represents upregulation (red) or downregulation (blue) of probes. Outliers are marked in orange (upregulated) or green (downregulated). (C–H) STRING visualization of known and predicted physical and functional interactions between the proteins organized in cluster 1 (C), clusters 2, 7 and 9 (D), clusters 3 and 5 (E), cluster 4 (F), cluster 6 (G) and cluster 8 (H).

